If you read any of my fantasy football buy-low, sell-high articles from last year, you know that I love high-volume, high upside fantasy players. However, raw targets and carries are only part of the equation.
On average, a goal-line carry is worth more than a carry from your own 20-yard line. A red-zone target is worth more than a target at midfield. A 40-yard bomb is worth more than a screen pass behind the line of scrimmage.
That’s obvious.
The less obvious part is determining exactly how much more valuable one play is than the next. Fortunately, we can quantify the exact value of each opportunity using my Expected Fantasy Points model.
EXPECTED FANTASY POINTS
I built the model based on a metric called Expected Fantasy Points (xFP). A player’s xFP is calculated based on the value of each target or carry, using historical data attributes that correlate highly with actual fantasy points scored. All data in this article uses full PPR scoring.
Expected Fantasy Points essentially show what an average player would have done with the opportunities seen by any given player. We can then subtract the player’s actual fantasy points scored to arrive at the difference, a key metric.
HOW TO INTERPRET EXPECTED FANTASY POINTS
The difference between expected and actual fantasy points comes from two sources:
Talent/Situation
We would expect the most talented players in the NFL to score more fantasy points than their expected fantasy points. That’s pretty obvious since xFP is based on the averages of all players. Also, a given coach or scheme might lead to a sustainable difference in actual over expected points. A carry in Kyle Shanahan’s offense will typically produce more points than a carry in Adam Gase’s offense. A carry behind an elite offensive line would be more valuable than a poor one.
These are all sustainable ways for a player to consistently outperform or underperform their expected points. Because of these differences between players, we should not assume that the difference between expected and actual points will always regress to zero. In other words, don’t blindly buy any player with a negative difference. Don’t sell every player with a positive difference.
Luck
The main reason to use expected fantasy points is to identify players who are experiencing very bad or very good luck. Unlike the previous differences, luck will even out over a long period. We want to buy players who are having bad luck and sell players who are having good luck.
Separating differences that are sustainable from differences due to luck can be tricky. It’s not an exact science. However, most players will score within a few points per game of their expected fantasy points for the season. The players with the largest differences are the ones most likely to be benefitting or suffering from luck.
Model Inputs
Now that you understand the value of Expected Fantasy Points, I will explain how I calculate Expected Fantasy Points in my model. If you don’t care about the details, skip this section. If you have more detailed questions or comments, let me know on Twitter @RSJ_Jackson
First, I started with play-by-play data from nflfastR. The dataset includes every play from Week 1. Then, I calculated Expected Fantasy Points for every single play using three inputs: distance from the end zone (for carries), distance from the end zone (for targets), and depth of target (for targets).
Charts
Scott Barrett, currently with FantasyPoints, published data for each of the three inputs:
And we see something similar with targets as well. pic.twitter.com/11JvitDIhw
— Scott Barrett (@ScottBarrettDFB) April 8, 2017
Expected fantasy points per target, by depth of target (air yards). [PPR vs. Standard] pic.twitter.com/sBzkQxqxkQ
— Scott Barrett (@ScottBarrettDFB) February 10, 2017
These values are from previous years, but they are extremely sticky from year to year.
EXPECTED FANTASY POINTS WEEK 1
After calculating actual and expected points for every play, I simply match each play with the relevant player to generate the output. Roughly the top 230 players for Week 1 are included.
You can find the data below:
| Player | Team | Position | Actual Fantasy Points | Expected Fantasy Points | Difference | Carries | Targets | Air Yards |
|---|---|---|---|---|---|---|---|---|
| D.WALLER | LV | TE | 26.5 | 34.1 | -7.6 | 0 | 19 | 203 |
| A.COOPER | DAL | WR | 38.9 | 31.8 | 7.1 | 0 | 16 | 127 |
| T.HILL | KC | WR | 37.1 | 28.5 | 8.6 | 1 | 15 | 231 |
| C.LAMB | DAL | WR | 23.4 | 26.8 | -3.4 | 0 | 15 | 159 |
| S.DIGGS | BUF | WR | 15.9 | 25.4 | -9.5 | 0 | 14 | 150 |
| C.MCCAFFREY | CAR | RB | 27.7 | 25.2 | 2.5 | 21 | 9 | 5 |
| C.GODWIN | TB | WR | 23.5 | 24.3 | -0.8 | 0 | 14 | 111 |
| D.COOK | MIN | RB | 20.4 | 23.6 | -3.2 | 20 | 7 | -9 |
| D.CHARK | JAX | WR | 17.6 | 23.5 | -5.9 | 0 | 12 | 199 |
| K.ALLEN | LAC | WR | 19 | 23.5 | -4.5 | 0 | 13 | 112 |
| D.SWIFT | DET | RB | 24.4 | 23.2 | 1.2 | 11 | 11 | 7 |
| C.BEASLEY | BUF | WR | 14 | 22.9 | -8.9 | 0 | 13 | 78 |
| M.WILLIAMS | LAC | WR | 22.2 | 21.7 | 0.5 | 0 | 12 | 118 |
| J.MIXON | CIN | RB | 25 | 21.5 | 3.5 | 29 | 4 | 1 |
| D.SAMUEL | SF | WR | 31.9 | 20.8 | 11.1 | 0 | 12 | 100 |
| J.TAYLOR | IND | RB | 17.6 | 20.3 | -2.7 | 17 | 7 | -8 |
| A.GIBSON | WAS | RB | 11.8 | 19.7 | -7.9 | 20 | 5 | 3 |
| M.DAVIS | ATL | RB | 10.2 | 19.4 | -9.2 | 15 | 6 | -3 |
| J.WILLIAMS | DET | RB | 25 | 19.2 | 5.8 | 9 | 9 | 2 |
| T.HOCKENSON | DET | TE | 25.7 | 18.5 | 7.2 | 0 | 10 | 65 |
| A.ROBINSON | CHI | WR | 9.5 | 18.4 | -8.9 | 0 | 11 | 42 |
| N.HINES | IND | RB | 14.2 | 18.3 | -4.1 | 9 | 8 | -2 |
| D.JOHNSON | PIT | WR | 14.6 | 17.5 | -2.9 | 0 | 10 | 51 |
| A.THIELEN | MIN | WR | 30.2 | 17.4 | 12.8 | 0 | 10 | 73 |
| C.KUPP | LA | WR | 23.8 | 17.4 | 6.4 | 0 | 10 | 71 |
| M.VALDES-SCANTLING | GB | WR | 4.7 | 17.1 | -12.4 | 0 | 8 | 156 |
| J.JEFFERSON | MIN | WR | 12.54 | 17 | -4.46 | 0 | 9 | 113 |
| D.HARRIS | NE | RB | 11.7 | 17 | -5.3 | 23 | 3 | 5 |
| M.SANDERS | PHI | RB | 17.3 | 16.9 | 0.4 | 16 | 5 | -10 |
| A.KAMARA | NO | RB | 18.1 | 16.3 | 1.8 | 20 | 4 | -4 |
| S.SHEPARD | NYG | WR | 24.3 | 16 | 8.3 | 0 | 9 | 94 |
| M.JONES | JAX | WR | 18.7 | 16 | 2.7 | 0 | 9 | 104 |
| L.FOURNETTE | TB | RB | 10.9 | 15.9 | -5 | 9 | 7 | -4 |
| L.SHENAULT | JAX | WR | 12.9 | 15.8 | -2.9 | 1 | 9 | 28 |
| K.OSBORN | MIN | WR | 14.6 | 15.7 | -1.1 | 0 | 9 | 71 |
| J.MEYERS | NE | WR | 10.4 | 15.5 | -5.1 | 0 | 9 | 63 |
| H.RENFROW | LV | WR | 13 | 15.5 | -2.5 | 0 | 9 | 62 |
| J.SMITH-SCHUSTER | PIT | WR | 9.2 | 15.4 | -6.2 | 0 | 8 | 50 |
| D.HENRY | TEN | RB | 10.7 | 15.4 | -4.7 | 17 | 4 | 6 |
| E.SANDERS | BUF | WR | 9.2 | 15.4 | -6.2 | 0 | 8 | 149 |
| D.MOORE | CAR | WR | 15.4 | 15.1 | 0.3 | 1 | 8 | 94 |
| M.INGRAM | HOU | RB | 14.5 | 14.9 | -0.4 | 26 | 1 | 19 |
| C.RIDLEY | ATL | WR | 10.1 | 14.6 | -4.5 | 0 | 8 | 92 |
| S.WATKINS | BAL | WR | 13.6 | 14.5 | -0.9 | 0 | 8 | 90 |
| A.BROWN | TEN | WR | 14.9 | 14.4 | 0.5 | 0 | 8 | 83 |
| D.HOPKINS | ARI | WR | 26.3 | 14.4 | 11.9 | 0 | 8 | 90 |
| K.PITTS | ATL | TE | 7.1 | 14.3 | -7.2 | 0 | 8 | 60 |
| D.PARKER | MIA | WR | 12.1 | 14.3 | -2.2 | 0 | 7 | 84 |
| A.BROWN | TB | WR | 23.7 | 14.2 | 9.5 | 1 | 7 | 144 |
| D.SINGLETARY | BUF | RB | 11 | 14.2 | -3.2 | 11 | 5 | 5 |
| N.FANT | DEN | TE | 12.2 | 14 | -1.8 | 0 | 8 | 55 |
| J.CHASE | CIN | WR | 20.9 | 14 | 6.9 | 1 | 7 | 114 |
| J.COOK | LAC | TE | 10.6 | 14 | -3.4 | 0 | 8 | 67 |
| J.O'SHAUGHNESSY | JAX | TE | 10.8 | 14 | -3.2 | 0 | 8 | 39 |
| D.SMITH | PHI | WR | 19.1 | 14 | 5.1 | 0 | 8 | 56 |
| Q.CEPHUS | DET | WR | 12.2 | 13.9 | -1.7 | 0 | 7 | 102 |
| J.WHITE | NE | RB | 12.1 | 13.7 | -1.6 | 4 | 7 | 29 |
| R.GRONKOWSKI | TB | TE | 29 | 13.7 | 15.3 | 0 | 8 | 53 |
| N.HARRIS | PIT | RB | 5.9 | 13.6 | -7.7 | 16 | 3 | 3 |
| B.COOKS | HOU | WR | 18.2 | 13.5 | 4.7 | 0 | 7 | 132 |
| K.DRAKE | LV | RB | 12 | 13.4 | -1.4 | 6 | 5 | 13 |
| K.HUNT | CLE | RB | 17.1 | 13.2 | 3.9 | 7 | 3 | -2 |
| C.DAVIS | NYJ | WR | 26.7 | 13.1 | 13.6 | 0 | 7 | 118 |
| C.CARSON | SEA | RB | 12.7 | 13 | -0.3 | 16 | 3 | -3 |
| J.ROBINSON | JAX | RB | 8.4 | 13 | -4.6 | 5 | 6 | 17 |
| B.BERRIOS | NYJ | WR | 10.1 | 12.9 | -2.8 | 0 | 7 | 39 |
| M.GASKIN | MIA | RB | 12.6 | 12.8 | -0.2 | 9 | 5 | 5 |
| C.EDWARDS-HELAIRE | KC | RB | 10.2 | 12.7 | -2.5 | 14 | 3 | -4 |
| D.SLAYTON | NYG | WR | 9.5 | 12.7 | -3.2 | 0 | 7 | 83 |
| J.JEUDY | DEN | WR | 13.2 | 12.7 | 0.5 | 0 | 7 | 83 |
| N.AGHOLOR | NE | WR | 18.2 | 12.6 | 5.6 | 0 | 7 | 79 |
| D.ADAMS | GB | WR | 10.6 | 12.5 | -1.9 | 0 | 7 | 51 |
| C.EDMONDS | ARI | RB | 14.6 | 12.4 | 2.2 | 12 | 4 | -12 |
| T.KELCE | KC | TE | 25.6 | 12.3 | 13.3 | 0 | 7 | 54 |
| D.MOONEY | CHI | WR | 7.6 | 12.1 | -4.5 | 0 | 7 | 43 |
| M.GALLUP | DAL | WR | 7.6 | 11.9 | -4.3 | 0 | 7 | 42 |
| C.KMET | CHI | TE | 9.2 | 11.7 | -2.5 | 0 | 7 | 31 |
| T.WILLIAMS | BAL | RB | 18.4 | 11.5 | 6.9 | 9 | 4 | 0 |
| K.GOLLADAY | NYG | WR | 10.4 | 11.1 | -0.7 | 0 | 6 | 90 |
| D.WILLIAMS | CHI | RB | 8 | 11.1 | -3.1 | 6 | 5 | 0 |
| M.BROWN | BAL | WR | 19.4 | 11.1 | 8.3 | 1 | 6 | 48 |
| C.ROGERS | TEN | WR | 10.2 | 11 | -0.8 | 0 | 6 | 61 |
| J.JONES | TEN | WR | 5.9 | 10.8 | -4.9 | 0 | 6 | 63 |
| M.EVANS | TB | WR | 5.4 | 10.8 | -5.4 | 0 | 6 | 46 |
| M.GORDON | DEN | RB | 20.8 | 10.7 | 10.1 | 11 | 3 | -2 |
| N.CHUBB | CLE | RB | 22.1 | 10.6 | 11.5 | 15 | 2 | -4 |
| T.BENSON | DET | WR | 4.9 | 10.6 | -5.7 | 0 | 6 | 45 |
| A.SCHWARTZ | CLE | WR | 11.6 | 10.6 | 1 | 1 | 5 | 126 |
| J.WADDLE | MIA | WR | 16.1 | 10.6 | 5.5 | 0 | 6 | 66 |
| A.GREEN | ARI | WR | 4.5 | 10.5 | -6 | 0 | 6 | 53 |
| T.HIGBEE | LA | TE | 11.8 | 10.5 | 1.3 | 0 | 6 | 28 |
| T.MARSHALL | CAR | WR | 5.6 | 10.5 | -4.9 | 0 | 6 | 52 |
| D.SCHULTZ | DAL | TE | 10.5 | 10.3 | 0.2 | 0 | 6 | 14 |
| A.TRAUTMAN | NO | TE | 4.8 | 10.3 | -5.5 | 0 | 6 | 31 |
| K.RUDOLPH | NYG | TE | 2.8 | 10.2 | -7.4 | 0 | 5 | 34 |
| R.GRIFFIN | NYJ | TE | 5.2 | 10 | -4.8 | 0 | 6 | 24 |
| J.REAGOR | PHI | WR | 16.9 | 10 | 6.9 | 0 | 6 | 6 |
| T.LOCKETT | SEA | WR | 26 | 9.9 | 16.1 | 0 | 5 | 108 |
| S.BARKLEY | NYG | RB | 3.7 | 9.9 | -6.2 | 10 | 3 | 5 |
| J.MCNICHOLS | TEN | RB | 6.3 | 9.9 | -3.6 | 2 | 4 | 10 |
| J.WILLIAMS | DEN | RB | 5.1 | 9.9 | -4.8 | 14 | 1 | -8 |
| E.MITCHELL | SF | RB | 16.4 | 9.8 | 6.6 | 19 | 0 | 0 |
| H.RUGGS | LV | WR | 6.6 | 9.7 | -3.1 | 0 | 5 | 99 |
| D.HENDERSON | LA | RB | 15.7 | 9.7 | 6 | 16 | 1 | 3 |
| B.EDWARDS | LV | WR | 12.1 | 9.6 | 2.5 | 0 | 5 | 97 |
| D.MONTGOMERY | CHI | RB | 18.8 | 9.6 | 9.2 | 16 | 1 | 0 |
| C.CLAYPOOL | PIT | WR | 10 | 9.6 | 0.4 | 1 | 5 | 61 |
| D.NJOKU | CLE | TE | 10.6 | 9.4 | 1.2 | 0 | 5 | 102 |
| R.WOODS | LA | WR | 12.4 | 9.4 | 3 | 1 | 4 | 23 |
| D.METCALF | SEA | WR | 16 | 9.3 | 6.7 | 0 | 5 | 77 |
| K.GAINWELL | PHI | RB | 12.3 | 9.2 | 3.1 | 9 | 3 | -3 |
| P.BROWN | HOU | TE | 10.7 | 9.2 | 1.5 | 0 | 5 | 66 |
| G.DAVIS | BUF | WR | 12 | 9.2 | 2.8 | 0 | 5 | 66 |
| T.KROFT | NYJ | TE | 5.6 | 9.2 | -3.6 | 0 | 5 | 16 |
| C.KIRK | ARI | WR | 24 | 9.1 | 14.9 | 0 | 5 | 60 |
| J.JACOBS | LV | RB | 17 | 9 | 8 | 10 | 2 | 8 |
| Z.PASCAL | IND | WR | 20.3 | 9 | 11.3 | 0 | 5 | 42 |
| E.ELLIOTT | DAL | RB | 5.9 | 9 | -3.1 | 11 | 2 | 0 |
| J.LANDRY | CLE | WR | 19.4 | 8.9 | 10.5 | 1 | 5 | 16 |
| J.SMITH | NE | TE | 9.8 | 8.8 | 1 | 1 | 5 | 18 |
| T.POLLARD | DAL | RB | 8.3 | 8.8 | -0.5 | 3 | 4 | -9 |
| D.GOEDERT | PHI | TE | 14.2 | 8.8 | 5.4 | 0 | 5 | 34 |
| T.HIGGINS | CIN | WR | 15.8 | 8.7 | 7.1 | 0 | 5 | 41 |
| M.ANDREWS | BAL | TE | 5 | 8.7 | -3.7 | 0 | 5 | 38 |
| G.KITTLE | SF | TE | 9.8 | 8.6 | 1.2 | 0 | 5 | 28 |
| J.GUYTON | LAC | WR | 7.9 | 8.6 | -0.7 | 0 | 5 | 22 |
| R.MOORE | ARI | WR | 10.8 | 8.5 | 2.3 | 0 | 5 | 24 |
| D.AMENDOLA | HOU | WR | 14.4 | 8.4 | 6 | 0 | 5 | 20 |
| E.MOORE | NYJ | WR | 0.7 | 8.2 | -7.5 | 0 | 4 | 92 |
| D.JOHNSON | HOU | RB | 11.8 | 8.1 | 3.7 | 3 | 4 | 9 |
| J.CONNER | ARI | RB | 5.3 | 8 | -2.7 | 16 | 0 | 0 |
| K.HAMLER | DEN | WR | 7.1 | 7.9 | -0.8 | 0 | 4 | 86 |
| K.RAYMOND | DET | WR | 8.9 | 7.8 | 1.1 | 1 | 4 | 53 |
| A.EKELER | LAC | RB | 11.7 | 7.7 | 4 | 15 | 0 | 0 |
| C.HYDE | JAX | RB | 7.8 | 7.7 | 0.1 | 9 | 2 | -2 |
| A. ST. BROWN | DET | WR | 4.3 | 7.7 | -3.4 | 0 | 4 | 51 |
| T.JOHNSON | NYJ | RB | 3.6 | 7.5 | -3.9 | 4 | 3 | 29 |
| M.GOODWIN | CHI | WR | 8.3 | 7.4 | 0.9 | 1 | 4 | 28 |
| A.LAZARD | GB | WR | 3.6 | 7.3 | -3.7 | 0 | 4 | 47 |
| T.CONKLIN | MIN | TE | 8.1 | 7.3 | 0.8 | 0 | 4 | 31 |
| T.JONES | NO | RB | 6.3 | 7.2 | -0.9 | 11 | 1 | 0 |
| D.KNOX | BUF | TE | 8.1 | 7.2 | 0.9 | 0 | 4 | 23 |
| T.MCLAURIN | WAS | WR | 10.2 | 7.2 | 3 | 0 | 4 | 43 |
| T.BOYD | CIN | WR | 6.2 | 7.1 | -0.9 | 0 | 4 | 24 |
| D.BROWN | WAS | WR | 0.8 | 7.1 | -6.3 | 0 | 4 | 39 |
| M.PITTMAN | IND | WR | 5.9 | 7 | -1.1 | 0 | 4 | 30 |
| T.PATRICK | DEN | WR | 13.9 | 7 | 6.9 | 0 | 4 | 34 |
| A.DILLON | GB | RB | 3.6 | 6.9 | -3.3 | 4 | 2 | -2 |
| H.HURST | ATL | TE | 6.8 | 6.8 | 0 | 0 | 4 | 10 |
| C.PATTERSON | ATL | RB | 8.7 | 6.8 | 1.9 | 7 | 2 | 5 |
| C.WILSON | DAL | WR | 5.4 | 6.8 | -1.4 | 0 | 3 | 24 |
| J.DOYLE | IND | TE | 5.1 | 6.8 | -1.7 | 0 | 4 | 16 |
| S.AHMED | MIA | RB | 4.8 | 6.7 | -1.9 | 3 | 3 | 31 |
| A.FIRKSER | TEN | TE | 4.9 | 6.7 | -1.8 | 0 | 4 | 17 |
| B.JARWIN | DAL | TE | 5 | 6.7 | -1.7 | 0 | 4 | 15 |
| R.TONYAN | GB | TE | 2.8 | 6.4 | -3.6 | 0 | 4 | 2 |
| R.ANDERSON | CAR | WR | 12.7 | 6.4 | 6.3 | 0 | 3 | 92 |
| V.JEFFERSON | LA | WR | 16 | 6.3 | 9.7 | 0 | 3 | 87 |
| P.CAMPBELL | IND | WR | 3.4 | 5.8 | -2.4 | 0 | 3 | 50 |
| A.JONES | GB | RB | 4.2 | 5.8 | -1.6 | 5 | 2 | -1 |
| C.SUTTON | DEN | WR | 2.4 | 5.7 | -3.3 | 0 | 3 | 51 |
| P.LINDSAY | HOU | RB | 8.5 | 5.5 | 3 | 8 | 1 | -3 |
| M.CARTER | NYJ | RB | 3 | 5.4 | -2.4 | 4 | 2 | 0 |
| M.TAYLOR | GB | WR | 3.4 | 5.3 | -1.9 | 0 | 3 | 30 |
| G.BERNARD | TB | RB | 3.2 | 5.3 | -2.1 | 0 | 3 | 19 |
| T.SHERFIELD | SF | WR | 10.3 | 5.3 | 5 | 0 | 3 | 28 |
| M.THOMAS | CIN | WR | 1.5 | 5.3 | -3.8 | 0 | 3 | 28 |
| H.HENRY | NE | TE | 6.1 | 5.2 | 0.9 | 0 | 3 | 24 |
| W.DISSLY | SEA | TE | 6.7 | 5.2 | 1.5 | 0 | 3 | 20 |
| N.COLLINS | HOU | WR | 1.7 | 5.1 | -3.4 | 0 | 3 | 19 |
| K.HILL | LAC | WR | 6 | 5.1 | 0.9 | 0 | 3 | 18 |
| L.THOMAS | WAS | TE | 12 | 5.1 | 6.9 | 0 | 3 | 17 |
| A.HOOPER | CLE | TE | 5.7 | 5.1 | 0.6 | 0 | 3 | 16 |
| K.BOURNE | NE | WR | 2.7 | 5.1 | -2.4 | 0 | 3 | 16 |
| D.ARNOLD | CAR | TE | 2.6 | 5.1 | -2.5 | 0 | 3 | 15 |
| D.BYRD | CHI | WR | 4.9 | 5 | -0.1 | 0 | 3 | 13 |
| T.WILLIAMS | DET | WR | 3.4 | 5 | -1.6 | 0 | 3 | 13 |
| L.MURRAY | BAL | RB | 8.8 | 5 | 3.8 | 10 | 0 | 0 |
| D.BOOKER | NYG | RB | 2.3 | 4.9 | -2.6 | 4 | 1 | 2 |
| J.JOHNSON | NO | TE | 17.1 | 4.9 | 12.2 | 0 | 3 | 4 |
| Q.WATKINS | PHI | WR | 5.3 | 4.9 | 0.4 | 0 | 3 | -7 |
| A.OKWUEGBUNAM | DEN | TE | 8.6 | 4.8 | 3.8 | 0 | 3 | 2 |
| M.HARDMAN | KC | WR | 4.9 | 4.8 | 0.1 | 0 | 3 | 1 |
| T.COLEMAN | NYJ | RB | 2.4 | 4.8 | -2.4 | 9 | 0 | 0 |
| D.HARRIS | NO | WR | 15.2 | 4.4 | 10.8 | 0 | 2 | 66 |
| S.PERINE | CIN | RB | 3.9 | 4 | -0.1 | 5 | 1 | -3 |
| A.ABDULLAH | MIN | RB | 3.9 | 4 | -0.1 | 1 | 2 | 2 |
| L.ROUNTREE | LAC | RB | 2.7 | 4 | -1.3 | 8 | 0 | 0 |
| D.DUVERNAY | BAL | WR | 1.6 | 3.9 | -2.3 | 0 | 2 | 32 |
| Z.JONES | LV | WR | 12.6 | 3.9 | 8.7 | 0 | 2 | 41 |
| M.CALLAWAY | NO | WR | 2.4 | 3.9 | -1.5 | 0 | 2 | 39 |
| M.STRACHAN | IND | WR | 4.6 | 3.9 | 0.7 | 0 | 2 | 26 |
| D.ROBINSON | KC | WR | 1.9 | 3.8 | -1.9 | 0 | 2 | 33 |
| Z.ERTZ | PHI | TE | 5.4 | 3.7 | 1.7 | 0 | 2 | 31 |
| M.GESICKI | MIA | TE | 0 | 3.6 | -3.6 | 0 | 2 | 28 |
| E.EBRON | PIT | TE | 2.9 | 3.6 | -0.7 | 0 | 2 | 23 |
| I.THOMAS | CAR | TE | 2.7 | 3.6 | -0.9 | 0 | 2 | 15 |
| C.CONLEY | HOU | WR | 4.7 | 3.6 | 1.1 | 0 | 2 | 20 |
| D.JACKSON | LA | WR | 4.1 | 3.5 | 0.6 | 0 | 2 | 16 |
| N.WESTBROOK-IKHINE | TEN | WR | 2 | 3.5 | -1.5 | 0 | 2 | 16 |
| S.ANDERSON | LAC | TE | 1.1 | 3.5 | -2.4 | 0 | 2 | 15 |
| C.UZOMAH | CIN | TE | 5.5 | 3.5 | 2 | 0 | 2 | 15 |
| E.SAUBERT | DEN | TE | 1.7 | 3.5 | -1.8 | 0 | 2 | 0 |
| H.BRYANT | CLE | TE | 2.7 | 3.4 | -0.7 | 0 | 2 | 12 |
| J.GRAHAM | CHI | TE | 2.1 | 3.4 | -1.3 | 0 | 2 | 12 |
| R.GAGE | ATL | WR | 0 | 3.4 | -3.4 | 0 | 2 | 12 |
| A.HUMPHRIES | WAS | WR | 3 | 3.4 | -0.4 | 0 | 2 | 11 |
| D.SMYTHE | MIA | TE | 1.9 | 3.3 | -1.4 | 0 | 2 | 7 |
| B.PRINGLE | KC | WR | 1.6 | 3.3 | -1.7 | 0 | 2 | 3 |
| G.EVERETT | SEA | TE | 10 | 3.2 | 6.8 | 0 | 2 | 0 |
| C.HUBBARD | CAR | RB | 2.4 | 3.2 | -0.8 | 0 | 2 | 0 |
| R.BURKHEAD | HOU | RB | 1.6 | 3.1 | -1.5 | 0 | 2 | -4 |
| J.WASHINGTON | PIT | WR | 3 | 3.1 | -0.1 | 0 | 2 | -5 |
| K.TONEY | NYG | WR | 1.8 | 3 | -1.2 | 0 | 2 | -10 |
| R.JONES | TB | RB | -0.6 | 2.8 | -3.4 | 4 | 0 | 0 |
| D.ESKRIDGE | SEA | WR | 3.8 | 2.7 | 1.1 | 2 | 1 | 6 |
| R.COBB | GB | WR | 4.3 | 2.6 | 1.7 | 1 | 1 | 29 |
| J.PATTERSON | WAS | RB | 0.9 | 2.5 | -1.6 | 2 | 1 | -3 |
| K.HILL | GB | RB | 1.4 | 2.5 | -1.1 | 5 | 0 | 0 |
| M.BROWN | MIA | RB | 1.6 | 2.5 | -0.9 | 5 | 0 | 0 |
| J.JACKSON | LAC | RB | 1.7 | 2.5 | -0.8 | 1 | 1 | -2 |
| T.JOHNSON | JAX | WR | 1.6 | 2.3 | -0.7 | 0 | 1 | -3 |
| D.MIMS | NYJ | WR | 5 | 2.1 | 2.9 | 0 | 1 | 30 |
| J.HASTY | SF | RB | 8.8 | 2.1 | 6.7 | 1 | 1 | 0 |
| R.STEVENSON | NE | RB | 0.1 | 2.1 | -2 | 1 | 1 | -1 |
| A.MATTISON | MIN | RB | 1.6 | 2 | -0.4 | 1 | 1 | -3 |
| D.DALLAS | SEA | RB | 2 | 2 | 0 | 1 | 1 | -3 |
| M.BREIDA | BUF | RB | 0.4 | 2 | -1.6 | 4 | 0 | 0 |
| J.MCKISSIC | WAS | RB | 0.8 | 1.9 | -1.1 | 1 | 1 | -9 |
| S.MICHEL | LA | RB | 0.2 | 0.5 | -0.3 | 1 | 0 | 0 |
WEEK 2 TRADE TARGETS
During the season, the main purpose of using my Expected Fantasy Points model is to help you win trades. Remember, we want to buy players who are getting unlucky, and sell players who are getting lucky. Here’s a more general overview of my trading strategy. In addition, I posted a trade value chart yesterday with values for every player.
You should look at the data and come to your own conclusions, but several guys jump out to me.
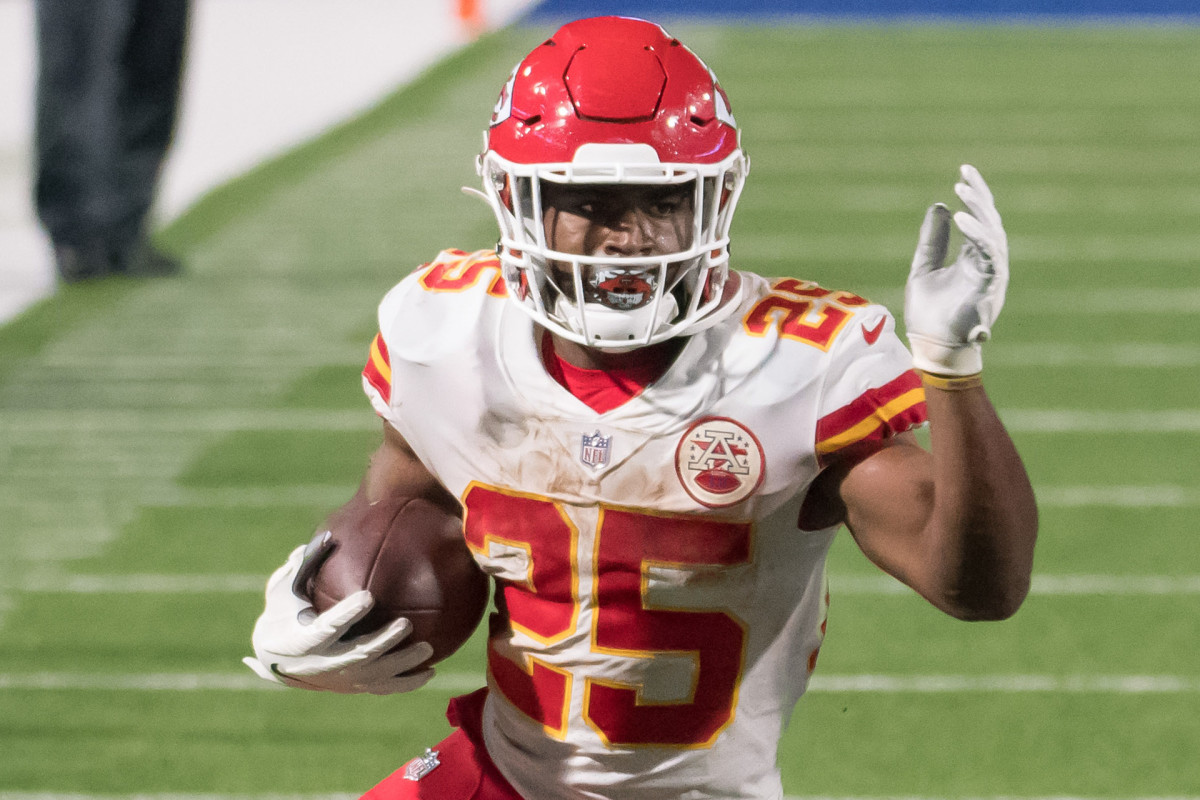
WEEK 2 BUY-LOW
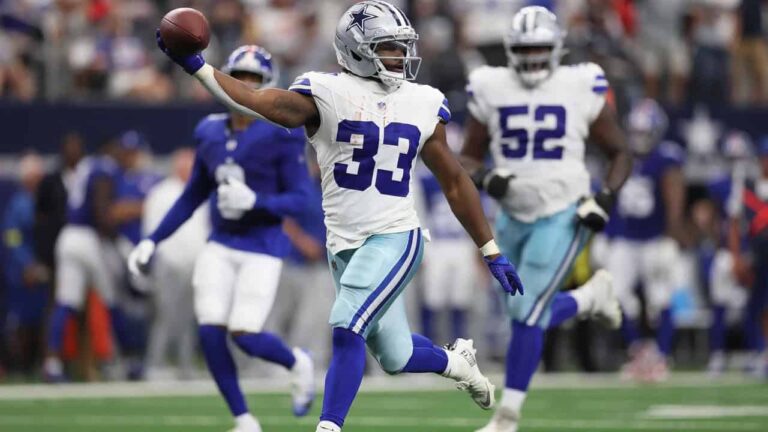
MIKE DAVIS
I liked Mike Davis’ projected workload coming into the season, and I am even more confident after seeing his Week 1 results. While Davis finished with a disappointing 10.2 PPR points, he saw 15 carries and 6 targets. That translated into 19.4 expected fantasy points (xFP), which was seventh among running backs in Week 1. He played 74.6% of the snaps and received 21 of Atlanta’s 30 running back opportunities (carries + targets) for the game.
If Davis saw this many opportunities on in a blowout loss, imagine what his volume could look like on a better day for the offense. He was heavily involved in the passing game, and he projects to be the primary goal-line back over backup Cordarelle Patterson.
In addition to the volume, Davis’s talent is underrated. In 2020, Davis finished second only to Nick Chubb with 0.26 missed tackles forced per rushing attempt. He also was solid in the passing game, finishing 12th of 46 qualified backs in PFF receiving grade.
Nobody is going to argue that Davis is the most talented back in the NFL, but he is a solid all-around player. In the 12 games he was active without Christian McCaffrey last year, Davis averaged a very respectable 16.8 expected fantasy points per game and proved he can handle a starting workload.
If the Davis manager is scared of Atlanta’s offense, look to trade someone like James Robinson for him. The Wolf and I both have Davis ranked higher for the rest of the season.
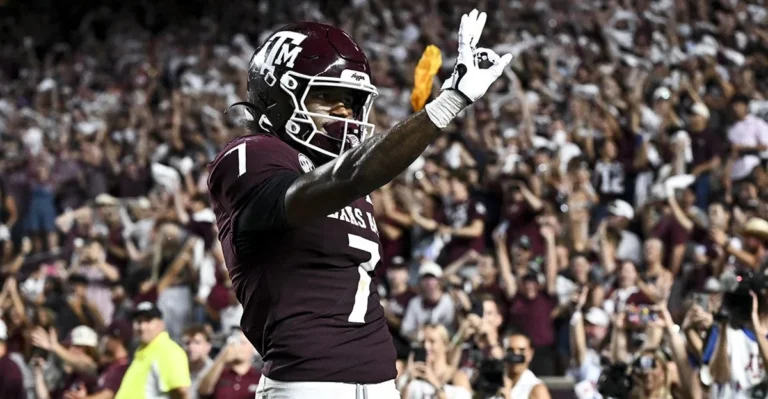
CLYDE EDWARDS-HELAIRE
I had major question marks about CEH’s workload coming into 2021. Over the first six games of 2020, he received a true RB1 level workload, averaging 21.5 xFP per game. He was handling most of the carries and playing a decent role in the passing game. His raw fantasy point totals weren’t great mostly due to poor touchdown luck, but he looked primed for positive regression in the second half of the season.
Then, the Chiefs signed Le’Veon Bell, and CEH’s workload fell off a cliff. He barely played half of the snaps and averaged only 11.5 xFP per game after the signing. Bell is gone now, but partially due to injury, Edwards-Helaire wasn’t able to fully recapture his early-season workload even after Bell became irrelevant down the stretch.
Thankfully for CEH owners, he played 72.3% of the snaps in Week 1 and dominated the team’s running back opportunities. Backup Darrel Williams had one carry, while CEH saw the remaining 14 carries and all three targets out of the backfield.
His 10.2 total points don’t jump off the page, but if Edwards-Helaire maintains a 70+% snap share and dominates touches like he did this week, he is going to have a workload closer to the first 6 weeks of 2020, which was elite. Kansas City trailed almost all of the game, and his 12.7 xFP will drastically increase if he maintains his bell-cow status in more positive game scripts in the future.
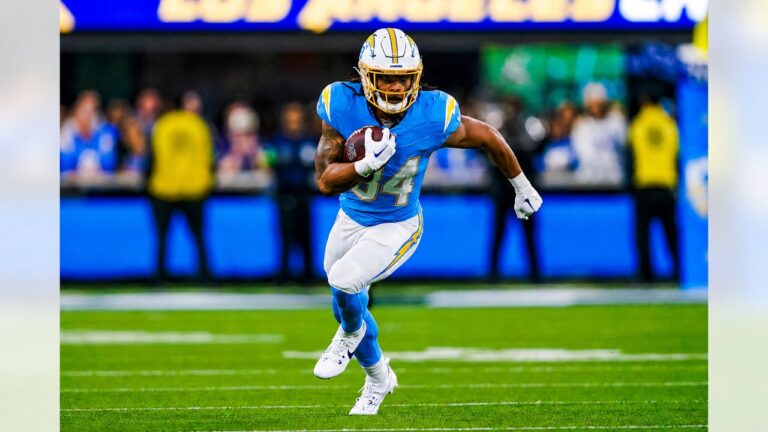
ALLEN ROBINSON
Robinson also posted disappointing results in Week 1 on impressive volume. Andy Dalton fed him a team-high 11 targets in a game where the Bears struggled to generate offense against a solid Rams defense. He only saw 42 air yards and an average depth of target (aDOT) of 3.8, but look for those numbers to increase next week.
In 2020, Robinson’s aDOT was 9.6. He fell slightly under the league average of 10.6, but he made up for it with elite target volume, which I expect to continue throughout 2021.
Robinson finished the week 11th in targets and xFP at the position, which is right around where he was drafted. He has proven to be a target hog who produces WR1 numbers in the Chicago offense, so take advantage of any potential Week 1 discount.
WEEK 2 SELL-HIGH
NICK CHUBB
In 2020, Chubb played 52.3% of the snaps in his healthy games. This was my pre-draft analysis of Chubb:
Chubb is a great player, but his low snap share and lack of receiving role limit his upside. Chubb made up for his lack of volume with elite talent and efficiency last year and still finished as the PPR RB7 on a per-game basis in 2020 after adjusting for in-game injury. He is a great player, but it is hard to see a ceiling much higher than his 2020 results without significantly more volume.
Here is The Wolf’s fantasy philosophy from his excellent 2021 Investing Guide, which I completely agree with:
I’m 100% an upside chaser. Always have been, and the great Scott Barrett explains clearly why that’s the right philosophy here.
To sum up his research: every fantasy season boils down to a small handful of “League-Winners,” and the rest simply don’t matter. If you owned Christian McCaffrey in 2019, you had a 48% chance of making your championship, regardless of who you surrounded him with. Insanity.
While frustrating for “analysts” (addicts) like myself who pour 12+ hours a day researching hundreds of players, perhaps you’ll be comforted knowing your job is unearthing only 2-3 true game-changers.
Thus, every one of your 15-20 “at bats” should be homerun hacks at finding these guys.
Chubb played an almost identical 52.5% of the snaps in Week 1, and his role remains unchanged. Given the same role, I see no path to league-winning upside, barring an injury to Kareem Hunt. He’s already maximizing the efficiency of his touches. He averaged 5.6 yards per carry last year and scored 12 times in 12 games, outperforming his expected value of just under 8.4 touchdowns.
Chubb’s 22.1-point Week 1 looks great, but he scored twice despite splitting goal line carries with Hunt. Hunt also out-targeted Chubb four to two.
I would much rather have a player like Joe Mixon who has the upside of a clear bell-cow and outproduced Chubb 21.5 to 10.6 in xFP this week. It’s not that I don’t like Chubb as a player, it’s just that he has enough value to return a player with legitimate league-winning upside.
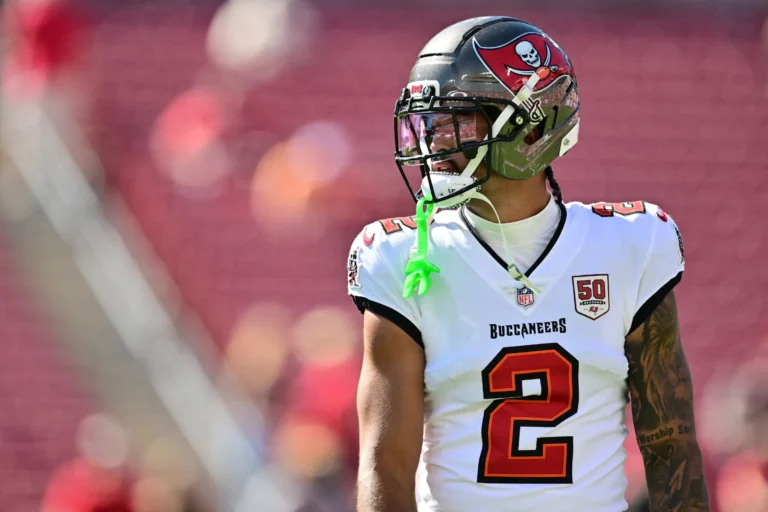
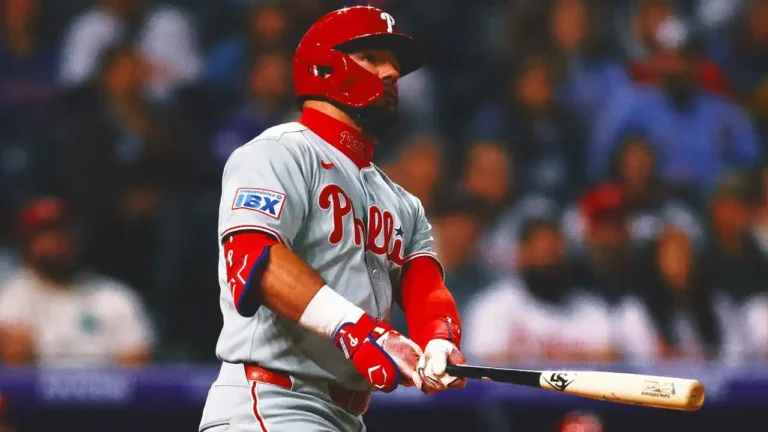
ANTONIO BROWN
Antonio Brown looked great on Thursday Night Football, catching a long touchdown on his way to scoring 23.7 PPR points. Brown put up a respectable seven targets, 144 air yards, and 14.2 xFP, but I’m not sure how sustainable those numbers are.
Tom Brady attempted 50 passes on Thursday, much higher than his 38.1 per game number from last year. Brown’s seven targets were only good for a 14% target share, as Chris Godwin led the team with 28% of the targets. With Godwin, Mike Evans, and Rob Gronkowski also competing for targets, it will be hard for Brown to consistently see enough volume when the total pass attempts regress to normal levels. He will certainly have some big games, but predicting who will get targets week to week will be difficult.
I would rather trade Brown for a player like Courtland Sutton (plus some other depth), who is also talented, and projects to consistently lead his team in targets in the wake of Jerry Jeudy’s high-ankle sprain. Another option is to include him in a bigger offer for one of the buy-low players above.
DALLAS GOEDERT
Managers expected a TE1 when they drafted Goedert, but his draft price assumed that teammate Zach Ertz would not play a major role. He out-snapped Ertz in Week 1, but Ertz was leading in snaps before exiting (and later returning) with a hamstring injury. Goedert only ran a route on 27 of Hurts’ 40 dropbacks, a 67.5% rate that likely would have been even lower if Ertz played the entire game.
A touchdown buoyed Goedert’s solid 14.2 PPR point week, but he still only saw five targets and 34 air yards. He finished tied for third on the team with Miles Sanders in targets, and he could fall even farther in the pecking order with a fully healthy Ertz next week.
I would try to attach a depth piece with Goedert to upgrade to a player like Tyler Higbee, Logan Thomas, or Noah Fant. Higbee and Thomas are running routes on nearly every passing play, and Fant has an opportunity to be the number two option in Denver’s passing game without Jeudy.
Week 1 TE Leaders by Route%
— Scott Barrett (@ScottBarrettDFB) September 13, 2021
1. Tyler Higbee – 96% (up from 53%, which ranked 31st)
2. Logan Thomas – 92%
3. Travis Kelce – 85%
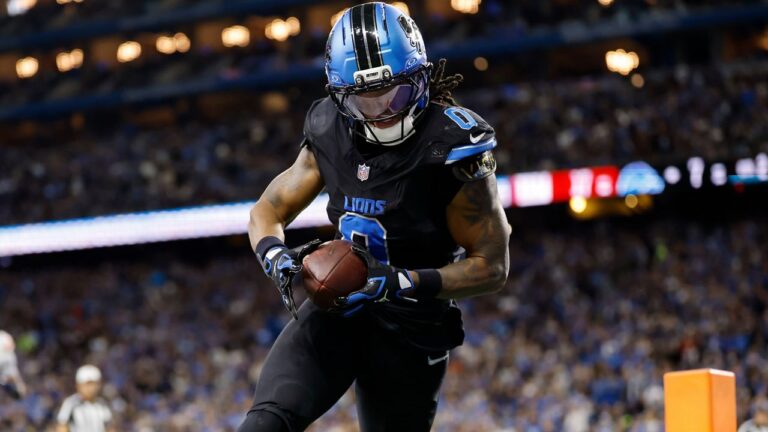
4. TJ Hockenson – 84%
5. Kyle Pitts – 79%
Here was the upside argument for Higbee. After tonight, I'm EXTREMELY bullish pic.twitter.com/XZAZXtrXqI
FINAL THOUGHTS
That’s all I have for Week 2. Now that you’re an Expected Fantasy Points Expert, you can use the tool to dominate your league. Check back next week for an updated trade value chart and more players to buy low and sell high. Please send any questions or feedback to @RSJ_Jackson on Twitter!