Don’t look now, but this 2024 Dynasty Fantasy Football Superflex Trade Value Chart comes courtesy of yours truly, Chase Marquette-Gaines. So not only will I be providing updated dynasty rankings as the NFL regular season comes to a close, but I will also be double-dipping by adding more context to those rankings through these trade value charts, normally brought to you by RSJ’s Jackson Barrett.
More context for the dynasty buy/sells can be found here, as well as among the latest risers and fallers.
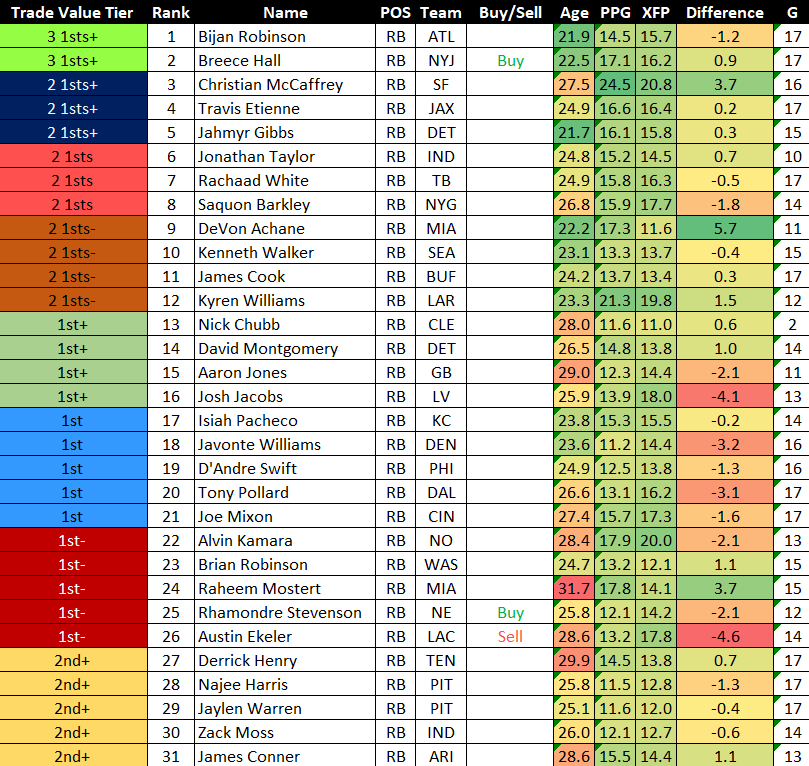
Tiers and rankings are based on a 12-team Superflex league with 10 starters and half-PPR scoring without TE premium. All draft pick values are assumed to be 2024 picks. Click the links below to see the value of other positions, but keep in mind that points per game and Expected Fantasy Points Data come from full-PPR sources.

*Players valued less than a third round pick are not included
DYNASTY TRADE CHART KEY
Trade Value Tier
This column provides the rough market value for each player in terms of draft capital. Players and picks can be combined to create fair offers. For example, a player worth three first-round picks would be roughly equivalent to a player worth two first-round picks plus a different player worth one first-round pick.
Rank
This column contains my dynasty rankings by position. I recommend focusing more on the trade value tier than the rank column. Players within the same tier are very similar, and I would usually like to trade players at the top of a tier for a lower-ranked player in the same tier if I can get draft picks or other assets on top. The rankings take market value into account.
Buy/Sell
Generally, these players aren’t deals where they’re at in the trade value tiers. Still, they are labeled “Buy” if you have a shot at acquiring them at considerably less than their trade chart value or “Sell” if you have a shot to trade at considerably more than their trade chart value.
PPG
Points per game scored in 2023 using full-PPR scoring
XFP (Expected Fantasy Points)
This column contains data from the same games throughout the 2023 NFL regular season.
XFP calculates the value of each target and rushing attempt based on the distance to the end zone and air yards. These historical data attributes correlate highly with fantasy points per game (PPR scoring).
For more information on Expected Fantasy Points and to utilize our XFP data tool, click the link below:
RSJ’S XFP TOOL: CARRIES, TARGETS, AND AIR YARDS FOR EVERY PLAYER
G
Games played in 2023
WHERE THIS TRADE CHART DIFFERS FROM PREVIOUS RSJ TRADE CHARTS
Personal bias is an inevitability among different people’s rankings. All factors that go into them will be prioritized a little differently.
I aim to pinpoint the median of where I think you can expect players to be traded for and away from your team, and even then, your roster construction will make some players more or less valuable depending on your team’s needs.
Influencing factors in my rankings include recent performance, established past performance, and market confidence.