If you followed along with my weekly DraftKings Milly Maker winning lineup analysis last year, you’ve already seen a lot of the talking points I’ll hit here. Part 1 reviews what kind of information we can harness from those lineups, before devising a strategy for 150-lineup, max entry contests in Part 2.
In 2021, Josh Allen was QB1 in points-per-game, scoring 1.28 more than the QB2. That same gap is present between the QB2 and QB5, and also between the QB6 and QB11.
Derrick Henry‘s 2.2 half-PPR points-per-game gap is the same gap that is present between the RB4 and RB11.
Cooper Kupp‘s 2.8 points-per-game gap is the same that is present between the WR3 and WR6. It’s also the same between the WR7 and the WR27.
Analysis of the weekly top 100 DraftKings Millionaire Maker lineups is very valuable. But as you go down the highest scoring lineups, you’ll quickly find that the gap between lineup scores becomes minimal, and even include duplicate lineups and duplicate scores.
Complement that analysis by looking solely at the Josh Allens, Derrick Henrys, and Cooper Kupps of Milly Maker contests, and you will be looking at hints and trends to give you insight into what separates the top lineup from the rest.
Here, I’m looking at the winning Milly Maker lineups in the main slate, that had a $20 buy-in, in 2021, weeks 1 to 17 (I prefer not to use the final week of regular seasons due to their potential for weird outcomes). Sometimes I’ll include 2020 also. Much of what I’m going over here are things I kept track of on a weekly basis last season.
Before we dive in, keep in mind that part of recognizing trends is recognizing when a smoke screen is disguised as a trend, with a couple of examples of that coming to fruition here.
CHECKING OUT THE STACKS
2021
Main stacks with no runback: 9
Of those:
- Single stacks: 5
- Double stacks: 4
Main stacks with a runback: 8
Of those:
- Single stacks: 5
- Double stacks: 2
- Triple stacks: 1
Most common stack with no runback (positions connected with “-” indicate the stack, the position after the “/” indicates the runback):
- QB-WR: 4
- QB-RB-WR: 2
- QB-RB-TE: 1
- QB-WR-WR: 1
- QB-TE: 1
Most common stack with a runback:
- QB-TE/WR: 3
- QB-WR-WR/TE: 2
- QB-WR/RB: 1
- QB-RB-WR-WR/TE: 1
- QB-WR/WR: 1
QB-WR made the most appearances, which shouldn’t be particularly surprising. Maybe mildly surprising is that QB-TE with a WR runback hit three times. It’s not as though there were repeats at TE (Dalton Schultz (wk 4), Tommy Tremble (wk 11), Mark Andrews (wk 15)).
There were repeats among the QB-WR stacks with Ceedee Lamb (wks 6 and 10), Keenan Allen (9 and 10), and Josh Allen (10 and 14), although no QB-WR combo was the same.
Winning Milly lineups offered a lot of stack variations, including Week 16’s Bengals triple-stack, the only time a triple-stack has happened in (at least) the last three years. There’s also variety in the QB-less stacks that were present:
- Lineups with one QB-less stack: 9
- Lineups with two QB-less stacks: 5
- Lineups with no QB-less stack: 3
Fitting three stacks in a lineup can be tricky, but Milly winners pulled it off five times, seldom having only one stack. And for that matter, every QB was part of a stack (aka no “naked-QB” lineups).
Most common QB-less stacks:
- RB-DEF: 6
- WR-DEF: 3
- RB/WR: 2
- WR-TE: 2
- RB-WR/WR: 1
- RB-TE/RB: 1
- RB-TE: 1
- WR-DEF/WR: 1
- WR/WR: 1
- WR/TE: 1
No surprise at the top two stacks on this list. The noteworthy stack that showed up multiple times here is the WR-TE stack, in weeks 1 and 9.
In Week 1, the WR-TE stack was Tyreek Hill and Travis Kelce. It’s perfectly understandable that Patrick Mahomes was left out of this lineup to leave salary cap room for other positions.
Week 9’s Jaylen Waddle–Mike Gesicki stack is trickier. Dolphins’ QB Jacoby Brissett scored 23 points less and cost $2,500 less than the lineup-winning QB. Jacoby’s 11.46-point output isn’t surprising, but that he’d still be able to feed Waddle and Gesicki enough to win a million bucks, is a bet I’d be hard-pressed to take.
Concerning the multiple RB/WR runbacks here, Derrick Henry‘s 50.7 points in Week 2 was complemented by Tyler Lockett‘s 34.8 points as the Seahawks tried to keep pace with the King.
And in Week 13, the Lions were without D’Andre Swift, making Jamaal Williams/Justin Jefferson a nice play when the Lions and Vikings faced off.
And even though Jamaal didn’t produce much, the logic still has merit: the potential of multiple NFL games fostering high fantasy output means that multiple runbacks can survive in one lineup.
2020
Main stacks with no runback: 7
Of those:
- Single stacks: 4
- no stack, aka “naked-QB”: 2
- Double stacks: 1
Main stacks with a runback: 9
Of those:
- Double stacks: 7
- Single stacks: 2
After six consecutive double stacks to start 2020, there were only two more through Week 16.
Most common main stacks with no runback:
- QB-WR: 3
- “Naked-QB”: 2
- QB-WR-TE: 1
- QB-TE: 1
Main stacks with a runback:
- QB-WR-WR/WR: 4 (the first four weeks, to be exact)
- QB-WR/WR: 2
- QB-WR-TE/WR: 2
- QB-RB-WR/WR: 1
Lineups with:
- One QB-less stack: 7
- Two QB-less stacks: 5
- No QB-less stacks: 4
Most common QB-less stacks:
- RB-WR: 4
- RB/WR: 4
- RB-WR/WR: 2
- RB-DEF: 1
- RB/RB: 1
- WR/WR: 1
- WR/TE: 1
- RB-WR/TE: 1
- WR/DEF: 1
- TE/DEF: 1
RB-DEF occurred six times in 2021, as opposed to just once in 2020. And, there were four RB-WR stacks in 2020, as opposed to none in 2021.
2021 and 2020 combined
Main stacks with no runback: 16
Of those:
- Single stacks: 9
- Double stacks: 5
- No stack, aka “naked-QB”: 2
Main stacks with a runback: 17
Of those:
- Double stacks: 9
- Single stacks: 7
- Triple stacks: 1
Most common stacks with no runbacks:
- QB-WR: 7
- QB-RB-WR: 2
- QB-TE: 2
- “Naked-QB”: 2
- QB-WR-WR: 1
- QB-WR-TE: 1
- QB-RB-TE: 1
Most common stacks with one runback:
- QB-WR-WR/WR: 4
- QB-WR/WR: 3
- QB-TE/WR: 3
- QB-WR-TE/WR: 2
- QB-WR-WR/TE: 2
- QB-WR/RB: 1
- QB-RB-WR/WR: 1
- QB-RB-WR-WR/TE: 1
Lineups with:
- One QB-less stack: 16 (48%)
- Two QB-less stacks: 10 (30%)
- No QB-less stacks: 7 (21%)
Most common QB-less stacks:
- RB-DEF: 7 (6 in 2021)
- RB/WR: 6
- RB-WR: 4 (all in 2020)
- WR-DEF: 3 (all in 2021)
- RB-WR/WR: 3
- WR/WR: 2
- WR/TE: 2
- WR-TE: 2
- RB/RB: 1
- RB-TE/RB: 1
- RB-TE: 1
- WR-DEF/WR: 1
- RB-WR/TE: 1
- WR/DEF: 1
- TE/DEF: 1
RB-DEF and WR-DEF happened ten times, with nine of them in 2021. Is this the field catching up to a legitimate strategy? If I had to guess, I’d say yes.
HOW MANY PROJECTED POINTS WERE ASSIGNED TO THE GAMES THAT HAD THE WINNING STACK/RUNBACK?
It’s logical to stack and runback the game that the Vegas oddsmakers predicted as the highest-scoring game on the slate, but how often did that work out?
Consider this info, where the team listed first is the one that had the winning stack in 2021:
- Week 1 – 6th highest total out of 12 games (CIN vs MIN, Over/Under 47)
- Week 2 – 3rd/13 (TB vs ATL, O/U 52.5)
- Week 3 – 8th/13 (BUF vs WAS, O/U 45.5) [had runback]
- Week 4 – tied for 3rd/13 (DAL vs CAR, O/U 51) [had runback]
- Week 5 – 6th/12 (TB vs MIA, O/U 48)
- Week 6 – 5th/10 (CLE vs ARI, O/U 48)
- Week 7 – 2nd/10 (LAR vs DET, O/U 50.5) [had runback]
- Week 8 – 1st/12 (IND vs TEN, O/U 51) [had runback]
- Week 9 – tied for 2nd/11 (LAC at PHI, O/U 49.5)
- Week 10 – tied for 4th/11 (BUF at NYJ, O/U 48.5)
- Week 11 – 11th/12 (CAR vs WAS, O/U 43) [had runback]
- Week 12 – 4th/10 (LAR vs GB, O/U 46.5)
- Week 13 – tied for 7th/11 (PHI at NYJ, O/U 44.5)
- Week 14 – 1st/11 (BUF at TB, O/U 53)
- Week 15 – tied with three other teams for 3rd/9 (BAL vs GB, O/U 43.5) [had runback]
- Week 16 – 6th/11 (CIN vs BAL, O/U 43.5) [had runback]
- Week 17 – 2nd/14 (CIN vs KC, O/U 51) [had runback]
These numbers use FOX Bet’s weekly closing lines. FOX Bet’s lines were negligibly different from other Vegas sportsbooks, and very easily accessible.
Here we see that in weeks 3, 11, 13, and 16, the winning stack ranked in the bottom half of the game’s projected overall point total for the week.
The highest projected points game only coincided with the winning stack twice, among multiple 2nd, 3rd, 4th, and 6th place totals.
If we average all the weeks, we get 4.5 out of 11.5, with an over/under of 48.
The winning stack belonged to the home team 13 out of the 17 weeks. The biggest takeaway from this data is that for the eight weeks the winning Milly lineup had a runback, the winning stack belonged to the home team every time. That’s quite the coincidence, but do previous years imply that we should start making sure our main stacks are home teams if we are adding a runback?
No. In 2019 and 2020 combined, there were 10 runbacks when the main stack was the home team, but seven runbacks when the stack was the away squad.
SALARY USED
- $50,000: 11 times
- $49,900: 3 times
- $49,800: twice
- $49,700: once
The recommendation to use all $50,000 went unchallenged. The best possible lineup each week, outlined at linestarapp.com, didn’t much stray from that strategy either. Only four weeks were the salary totals less than $49,600, with two weeks of $49,200, one of $46,900, and one of a ridiculous $43,800 (week 15).
Per player, the winning stack/runback cost $6,014. It was as low as $4250 (week 13) and as high as $7700 (week 10).
Only four times did the per-player cost fall outside the $5175-$6900 range.
2020
Stack/runback per-player cost: $6243
Only four times did the per-player cost fall outside the $5250-$7000 range ($4800, $4950, $7600, $7900)
2020 and 2021 combined
Stack/runback per-player cost: $6125
Only eight out of thirty-three times did the per-player cost fall outside the $5175-$7000 range.
PLAYER OWNERSHIP PERCENTAGES
- 1 – 78.1%
- 2 – 87.9%
- 3 – 72%
- 4 – 88.6%
- 5 – 115.8%
- 6 – 93%
- 7 – 91.4%
- 8 – 114.7%
- 9 – 102.9%
- 10 – 121.8%
- 11 – 28% (outlier-r-r-r-r-r-r-r-r)
- 12 – 91.6%
- 13 – 116.3%
- 14 – 82.9%
- 15 – 120%
- 16 – 117.4%
- 17 – 114.6%
Average — 96.3%
Week 11 was a weird week with just a 28% total player ownership percentage, which is way outside the normal range and not even close to the other weeks’ percentages.
If we take away the Week 11 outlier, the average is 100.56%, right smack in the middle of the recommended 75-125% range that has been around since Adam Levitan introduced it a couple years ago. Only Week 3 (72%) was the only other week outside the range.
It’s interesting that through the first seven weeks, the percentage was above 93 percent only once.
IN THE FLEX
- WR: 8
- RB: 7
- TE: 2
Not a lot to say here, besides that each time TE was in the flex, they were the top-2 scoring TE’s at the position for the week.
In 2020, that was not at all the case. For the weeks that the winning lineup had TE in the flex, that week’s TE2 was the 5th, 7th, and 28th-highest scoring TEs that week.
AVERAGE WINNING SCORE AND PERFECT SCORE
The average winning lineup scored 220.53 points. The average perfect lineup scored 255.66.
That’s a difference of 35.13 points, or 13.7-percent of the average perfect lineup score.
With that much room to beat the average winning score, it would be interesting if someday we could see how many possible lineups could’ve beaten each week’s winner, and how many of them strayed from using all $50,000 of the cap, or other weird attributes.
FINDING CLUES FROM IMPLIED TEAM TOTALS
Say a Bills-Jets game had an over/under of 48, and the Bills were minus-12.5. If the final score of the game perfectly matched those two lines, the Bills would have beaten the Jets 30.25-17.75.
We can’t count on that ever being an actual score, but we can take those implied team totals and keep track of them just like we do when we look at how high-scoring games are projected to be by the oddsmakers.
Each week, I looked at how each team ranked by implied team total, and compared them to how they ranked in their actual point total for the week.
After the season, I averaged how well each week’s highest implied total team actually ranked. I did the same thing for each week’s 2nd-highest implied total team, 3rd-highest, 4th-highest, etc:
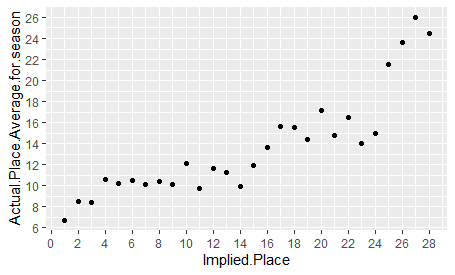
When a team was first place in actual point total, I gave them a value of 1. The second-highest actual point total got a value of 2, third-highest got a value of 3, etc.
The team that ranked the highest in implied team total throughout the season averaged between 6th and 7th place for the season in actual point total, with a value of 6.71.
Each week’s 2nd-highest implied total team’s average value was 8.47 in actual point total. And each week’s 3rd-highest implied total team’s average value was 8.44.
What the graph implies is tiers. A top tier for highest implied total team, a second tier that groups the 2nd- and 3rd-highest, and a third tier after that in which the waters become extremely murky and no longer provide clues to help us.
These charts can be opened in a new tab, if you have trouble zooming in:
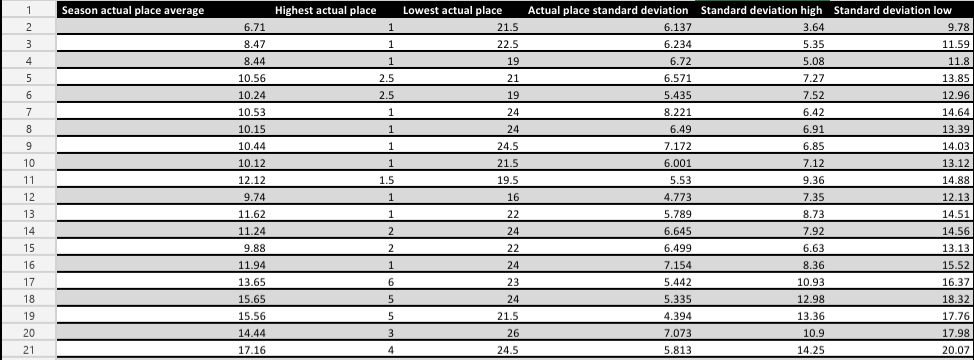
Each ranking’s standard deviation further implies the clarity of the lines in between those tiers. Each week’s 11th-highest implied total team had the least amount of variance throughout the season, with a standard deviation of 4.773. The highest amount of variance belonged to the 6th-highest implied teams, at a standard deviation of 8.221.
The three highest implied total teams sat comfortably in the middle, with deviations of 6.137, 6.234, and 6.72. This means that none of the three were substantially more or less variant than the others, making the lines between tiers a little more established.
This isn’t to say that any implied team total ranking is immune from having an incredibly good, or incredibly bad, week. Note how only the 11th-highest implied total team’s worst actual week was above 19th place. And, how it isn’t until the 13th-ranked team that we see a best actual place that’s 3rd-place or lower.
Note there was an edge in making lineup decisions based off of implied team total over projected total points, but it wasn’t by a lot.
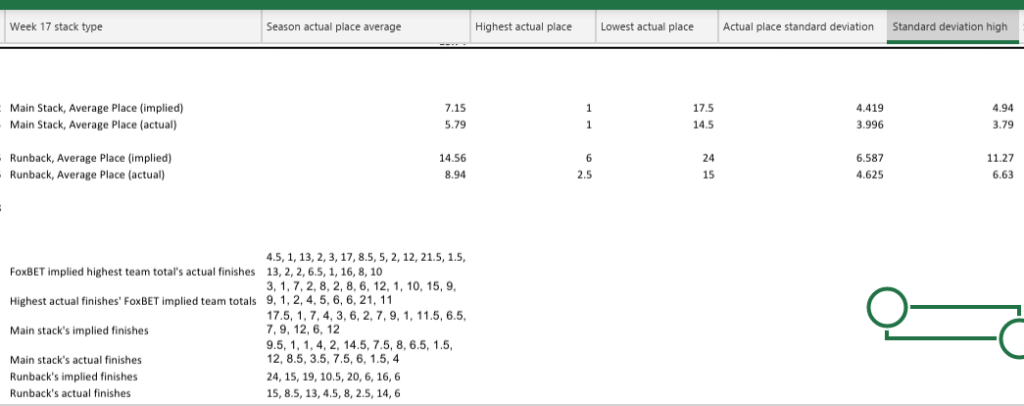
The highest implied total team was the main stack in the winning Milly lineup three times; the highest projected points game involved the main stack just twice.
The main stack averaged 4.5 out of 11.5 in the ranks of the highest projected points games for the season. The main stack averaged 5.79 out of 22.94 in the ranks of highest implied team total, which is equivalent to 2.91 out of 11.5.
The main stack’s implied team total ranking unsurprisingly matters, at 7.15 out of 22.94. But, you don’t seem to have to aim even remotely high with the implied total of your runback necessarily, which averaged just 14.56.
WHAT DOES IT ALL MEAN?
It means that we have guidelines of various importance to build on one more metric, that I use as the foundation of building a max entry, 150-lineup strategy in Part 2.