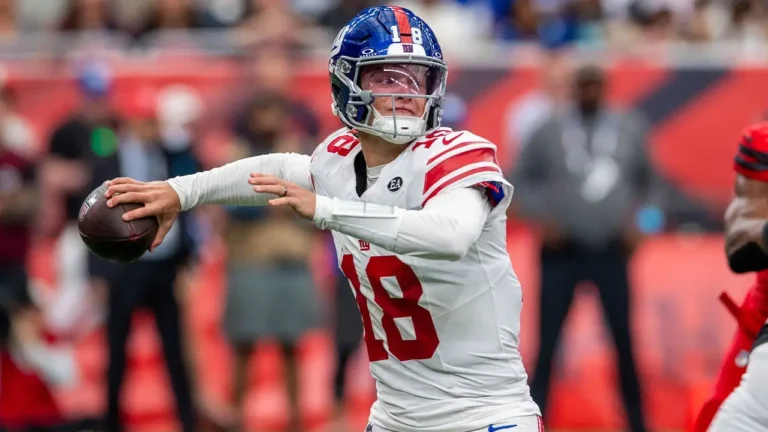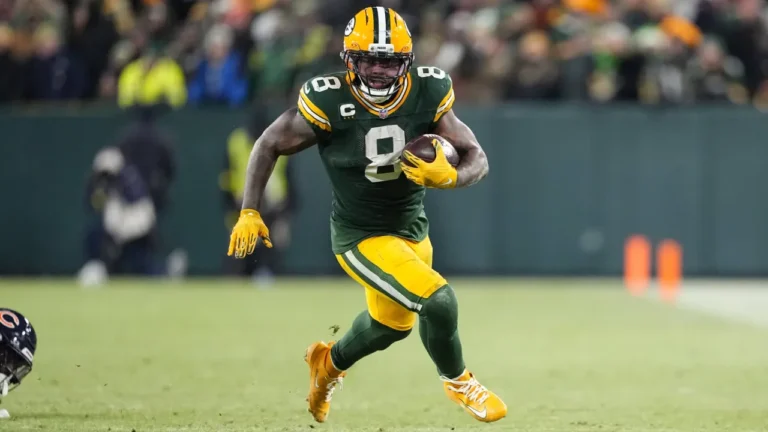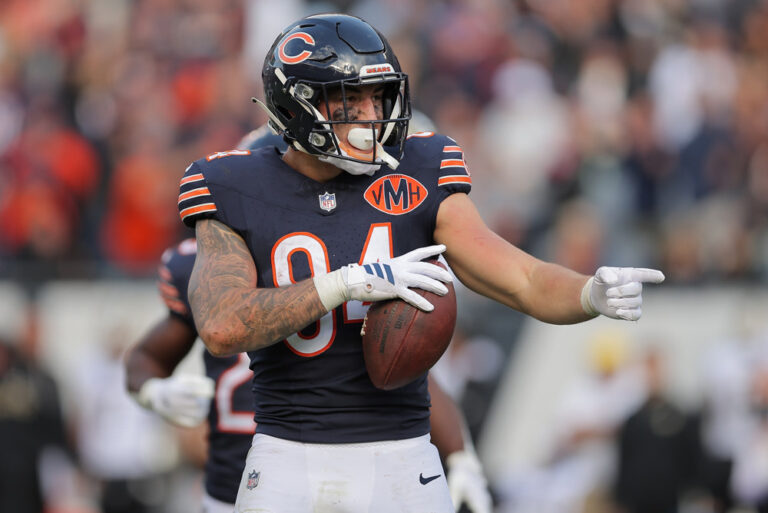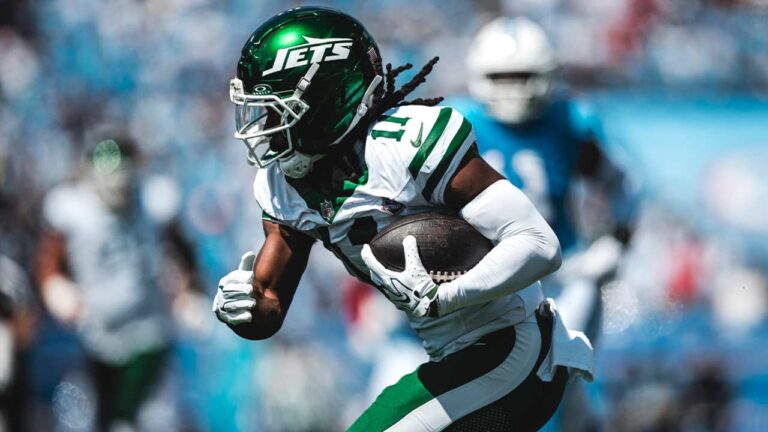
NFL box scores reveal what players accomplished, but they rarely explain how those opportunities developed. A wide receiver can finish with 100 yards despite playing fewer snaps than usual, while a running back might dominate playing time without receiving many valuable touches. For fantasy football managers and NFL betting analysts, understanding the difference between production and opportunity is essential.
These distinctions become particularly relevant when evaluating changing offensive roles, especially in markets involving the New York Giants and New York Jets. Fantasy managers typically examine snap counts, target shares, and projected workloads, while bettors may compare those same indicators against player prop lines. Anyone researching new york sports betting will encounter markets where small changes in playing time, offensive responsibilities, and game conditions can significantly affect individual player projections.
The central challenge is determining whether an apparent breakout represents a sustainable improvement or a temporary statistical anomaly. A useful evaluation starts with three elements: playing time, participation in meaningful opportunities, and how the market has adjusted to new information.
Why Snap Share Alone Can Misrepresent Player Value
Snap share measures the percentage of a team’s offensive plays on which a player participates. Although it provides a useful starting point, it does not reveal precisely what that player does on the field.
Consider a hypothetical receiver participating in 85% of his team’s offensive snaps. His playing time appears secure, but the percentage becomes less informative if he frequently blocks during running plays or rarely receives targets.
A different receiver participating in 65% of offensive snaps might actually offer greater fantasy potential if most of those appearances involve passing situations. His opportunity to accumulate receptions could exceed that of a more frequently used teammate.
This distinction matters for tight ends as well. An additional-blocking assignment may increase a tight end’s playing time without improving his receiving outlook.
The practical takeaway is that snap share measures presence, not necessarily offensive involvement. Analysts should examine participation alongside the specific responsibilities assigned to each player.
Route Participation Reveals Opportunities Hidden in Box Scores
Route participation offers a more targeted measurement of receiving opportunities. It identifies how frequently a player runs a receiving route when his team executes a passing play.
For example, suppose a receiver runs routes on 36 of his team’s 40 passing plays. His route participation rate is 90%, even if he finishes with only four targets.
That performance could suggest substantial future receiving opportunities despite a modest statistical result. However, analysts must still consider target competition, route depth, defensive coverage, and the quarterback’s tendencies.
A second receiver might record eight targets while running only 20 routes. His production looks stronger, but the unusually high concentration of targets may be difficult to sustain.
Comparing routes with targets helps distinguish opportunity from efficiency. Two measurements are particularly useful:
- Route participation rate: Routes run divided by team passing plays, using a consistent definition of eligible pass plays.
- Targets per route run: Targets received divided by routes run, indicating how frequently a player attracts the quarterback’s attention.
- Average depth of target: The average distance downfield of passes directed toward a receiver, which helps describe his receiving role.
- Target share: A player’s targets divided by total team pass attempts, using a consistent statistical convention.
These measurements answer different questions. Route participation indicates access to opportunities, while targets per route run helps evaluate the player’s involvement when available.
Neither guarantees future production, but together they offer a more informative perspective than receiving yards alone.
How Backfield Rotations Change Fantasy and Betting Expectations
Running back evaluation introduces another layer of complexity because offensive snaps can involve rushing attempts, receiving routes, pass protection, or decoy responsibilities.
A running back controlling 70% of offensive snaps may appear to have a substantial workload. However, his value depends heavily on whether those snaps translate into carries, receiving opportunities, and goal-line appearances.
Consider a hypothetical backfield featuring two players. The starter handles most early-down rushing attempts, while the second back receives substantial playing time during obvious passing situations.
The starter may be more relevant to rushing-yard projections, whereas the second player could have greater importance in reception-based fantasy formats.
The distinction becomes even more significant near the goal line. A reserve running back receiving short-yardage carries can have meaningful touchdown potential despite limited total playing time.
For this reason, backfield analysis should separate several responsibilities:
- Early-down carries: Opportunities during conventional rushing situations.
- Passing-down participation: Playing time during situations where a pass is more likely.
- Route involvement: Receiving opportunities rather than pass-protection assignments.
- Goal-line usage: Opportunities near the opponent’s end zone.
- Two-minute offense participation: Involvement when an offense prioritizes clock management and rapid passing plays.
Changes across these categories can affect fantasy projections and sportsbook markets differently. A larger rushing workload does not automatically create a corresponding increase in receptions or touchdowns.
Which NFL Role Changes Actually Deserve Attention?
Not every movement in playing time represents a permanent coaching decision. Some changes result from injuries, unusual scorelines, specific opponent matchups, or temporary personnel packages.
The following table provides a framework for evaluating different situations.
| Observed change | Possible fantasy implication | Relevant betting market | What to verify |
| Receiver’s route participation increases | More potential receiving opportunities | Receptions, receiving yards | Target share and passing volume |
| Running back gains early-down carries | Higher projected rushing volume | Rushing attempts, rushing yards | Backfield health and game script |
| Tight end receives fewer routes | Reduced receiving opportunity | Receptions, receiving yards | Blocking assignments |
| Reserve back gains goal-line responsibilities | Greater touchdown opportunity | Anytime touchdown scorer | Red-zone personnel usage |
| Receiver moves into the slot more frequently | Different target patterns and matchups | Receptions, receiving yards | Route depth and defensive coverage |
| Offense increases two-running-back packages | Possible redistribution of playing time | Rushing and receiving props | Personnel grouping consistency |
These relationships are analytical possibilities rather than guaranteed outcomes. The strength of any conclusion depends on the quality of the underlying data and the likelihood that the role change continues.
A single unusual game should generally carry less weight than repeated evidence supported by coaching decisions, injury developments, and offensive tendencies.
Why Sportsbook Lines May Not Reflect Role Changes Immediately
NFL player prop markets estimate outcomes under uncertain conditions. A receiving-yard line, for example, reflects expectations about a player’s opportunities, efficiency, offensive environment, and other factors.
When a player assumes additional responsibilities, the expected distribution of his production may change. However, the displayed betting line does not necessarily move in direct proportion to his increased playing time.
Suppose a receiver previously ran 25 routes per game and now projects for 35. His receiving opportunity has expanded, but estimating the effect requires additional information.
If his historical target rate was 20% per route, the simplified expectation would move from five targets to seven. That calculation assumes his target rate remains constant, which may not happen if the additional routes occur against different defensive coverages or within unfamiliar formations.
The relationship between projected targets and receiving yards also depends on completion probability and yards gained per reception.
Importantly, a difference between an analyst’s projection and a sportsbook line does not automatically indicate a profitable wager. Market prices include uncertainty and bookmaker margin, while alternative projections may contain incorrect assumptions.
A disciplined evaluation examines the available evidence before interpreting any apparent discrepancy.
Separating Meaningful Changes From Statistical Noise
One of the most common analytical mistakes is assigning excessive importance to a single NFL game.
Imagine a receiver whose snap participation increases from 55% to 80% in one week. That development attracts attention, but several explanations remain possible.
Perhaps a teammate suffered an injury, forcing a temporary lineup adjustment. Alternatively, the coaching staff might have deliberately expanded the receiver’s responsibilities.
The distinction matters because those explanations imply different expectations for the following game.
A useful verification process includes reviewing:
- Multiple weeks of snap and route participation.
- Official injury reports and player availability.
- Changes in offensive personnel groupings.
- Opponent-specific defensive matchups.
- Red-zone and third-down participation.
- Whether the same role continued in competitive game situations.
When several indicators move in the same direction, the evidence for a sustained role change becomes stronger.
Still, analysts should avoid interpreting correlation as certainty. A receiver might gain routes without attracting additional targets, and a running back might receive more carries without improving his efficiency.
How Game Script Changes the Value of Offensive Roles
Game script describes how the score and competitive circumstances influence a team’s offensive decisions.
A team protecting a substantial second-half lead may emphasize rushing attempts and clock management. A trailing team may increase passing volume, creating different opportunities for wide receivers and receiving-oriented running backs.
Consider a hypothetical Giants game in which the offense falls behind early. A running back specializing in pass protection and receiving could see more playing time, while an early-down runner might lose opportunities.
The opposite pattern could occur if the Giants establish a significant lead and prioritize rushing attempts.
These are conditional scenarios, not predictions about how any particular game will unfold. Their usefulness lies in identifying which offensive responsibilities could become more valuable under different circumstances.
For player prop evaluation, analysts should consider both the player’s expected role and the possible range of team-level offensive outcomes.
What New York NFL Bettors Should Verify Before Interpreting Props
The Giants and Jets provide useful contexts for applying role-based analysis because their offensive personnel decisions can be assessed using the same metrics as every other NFL team.
The objective is not to identify a particular player as an automatic betting opportunity. Instead, it is to determine whether a projection rests on reasonable assumptions about playing time, route involvement, and workload distribution.
For example, a receiving-yard projection should account for expected routes, likely targets, depth of target, and offensive passing volume. A rushing-yard projection should instead emphasize anticipated carries, rushing efficiency, and the potential effect of game script.
New York’s regulated mobile sports wagering environment also introduces jurisdictional requirements. Participants must be at least 21 years old and physically located within New York when placing mobile sports wagers through authorized operators.
Understanding these requirements is separate from evaluating NFL performance. Statistical analysis cannot remove financial risk or guarantee that a particular player prop is accurately priced.
A More Reliable Framework for NFL Player Evaluation
The most useful approach to NFL role changes begins with opportunity and works toward expected production, rather than starting with recent fantasy points or betting results.
Snap share provides a broad measure of participation. Route involvement, rushing responsibilities, target rates, and red-zone usage clarify how those appearances translate into meaningful opportunities.
The next step is determining whether the observed role is sustainable. Injuries, personnel changes, coaching decisions, and game conditions all influence that assessment.
Finally, fantasy managers and betting analysts must recognize that they are evaluating different outcomes. Fantasy scoring rewards combinations of player statistics according to league-specific rules, while sportsbook props settle against defined statistical thresholds and market conditions.
The central lesson is simple: an increase in playing time matters only when it changes the opportunities that determine production. Treating snap counts, routes, and offensive responsibilities as connected but distinct indicators provides a more defensible basis for interpreting NFL performance, fantasy projections, and betting lines.