Before this season began, I looked for trends solely among past first-place Millionaire Maker lineups and offered a sub-strategy when entering the maximum 150 lineups in any Draftkings contest that allows it.
Here, I’ll be looking at the first half of this season to see if the clues that have appeared in the past are consistent with 2022. By the first half of this season, I mean weeks 2 through 9, as I’ve begun to omit not just the last week of seasons, but now the first week, due to its potential for weird outcomes.
CHECKING OUT THE STACKS
Consistent with previous years, the winning lineups’ main stacks offered wide variety, with a new variation coming from week 4’s 48-45 scorigami between the Seahawks and Lions.
Stack types were single (2), double (2), single-one-runback (1), double-one-runback (2), and week 4’s double stack with a triple runback.
No main stack was the same as another week. Among them were QB-WR, QB-TE, QB-WR-WR, QB-WR-TE, QB-WR/RB, QB-WR-WR/TE, QB-WR-TE/WR, and the all too common QB-WR-WR/RB-WR-TE.
For QB-less sub-stacks, consistency is present as the only stack to show up multiple times (RB-DEF, appearing twice) is the most common sub-stack from previous years. Other sub-stacks include RB-WR, RB-WR-TE, RB/RB, and RB/WR.
More than half of the main stacks (5 of 8) had at least one sub-stack, and one lineup had two. Same as the previous two seasons, one sub-stack lineups appear most (50%, compared to 48% in ’20-’21). Only one lineup with two sub-stacks (12.5%) is a drop from ’20-’21, which was 30%. Will the second half of ’22 end up with more two sub-stack winners than normal?
DID IT PAY OFF TO STACK THE VEGAS ODDSMAKERS’ HIGHEST GAME IN PROJECTED TOTAL POINTS?
Last season, four out of 17 weeks saw the games the winning stack used rank in the bottom half of Vegas’ (or in this particular case, FoxBET’s) projected total points.
That saw an uptick through weeks 2 through 9 this season, happening three out of eight weeks.
If you averaged each week’s ranking last season, the winning stack used roughly 4.5’th out of 11.5’th place out of FoxBET’s total projected points predicted for the Draftkings main slate’s games.
This season, that average so far is 5th out 11.5’th place, so quite similar.
The winning stack used FoxBET’s highest projected points game only twice last year. This year is consistent with last year so far, with that occurrence only happening once.
Last year’s outcomes ranged in ranking from first to second to last. In line with last year, this year’s outcomes so far ranged from first to third to last.
SALARY USAGE
Last season, the winning lineup used all $50,000 of the salary cap 11 out of the 17 times (64.7%). Through the first half of this season, the whole cap’s been used seven out of eight times (87.5%). Does this mean the second half of the year won’t see more than three of four occurrences of this?
Per player, the main stack/runback has seen its highest cost so far, at $6544.
Whereas only eight out of thirty-three times has the average player cost for that week’s main stack/runback fallen outside the $5175-$7000 range during the 2020 and 2021 seasons, four times already has that average cost been above $7000 for 2022.
TOTAL PLAYER OWNERSHIP PERCENTAGES
Only twice last year did the winning lineups’ total player ownership percentage fall outside of the recommended 75-125% that Adam Levitan introduced a couple of years ago, and both times it fell below 75%.
This year, it’s already happened five times, consecutively during weeks 5-9 (128.2%, 54.1%, 189.2%, 174.2%, 125.5%).
Last year’s average total percentage among winning lineups was 96.3%. This year through week 9, it’s 121.43%. Will the second half of ’22 see lower percentages so that the average drops to around 100%, in the middle of the recommended 75-125% range, as it ended up last season?
IN THE FLEX
Consistent with last season, there are slightly more receivers in the flex so far (5) than RBs (3). Last season saw two TEs in the flex, this season hasn’t seen any through week 9.
DIFFERENCE BETWEEN THE WINNING LINEUP’S SCORE AND THE PERFECT LINEUP’S SCORE
Linestarapp.com gives each week’s highest-scoring lineup possible, reminding us exactly how beatable even the winning Milly lineup is. Last year, the average distance between the Milly winner and the perfect lineup was 35.13 points (13.7% of the perfect score). This year the gap is smaller, at 29.02 points, or 10.4%.
Consistent with last season, even the perfect lineup finds it hard to stray from spending all, or very close to all, of the salary cap, even if it isn’t as strict about spending all $50,000 than the winning Milly lineups are.
Through week 9, the perfect lineup spent all $50,000 twice and dropped below $49,600 only twice ($49,100 and $47,800).
HOW IMPLIED TEAM TOTAL CORRELATED WITH ACTUAL PLACE
In 2021, the implied team total that Vegas oddsmakers (or in this particular case, FoxBET oddsmakers) assigned to teams correlated pretty well with how well those teams actually did:
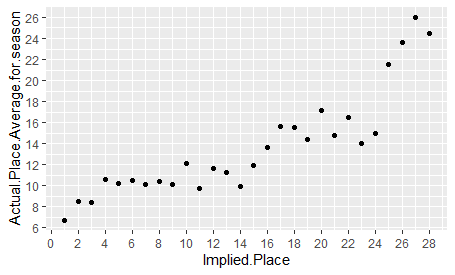
As the plot shows, for teams whose implied team total place was 1st through 15th place, their average actual place for the season was between 6th and 12th place, before falling off a cliff. There were no big outliers.
Through weeks 2-9 this year, there have been outliers:
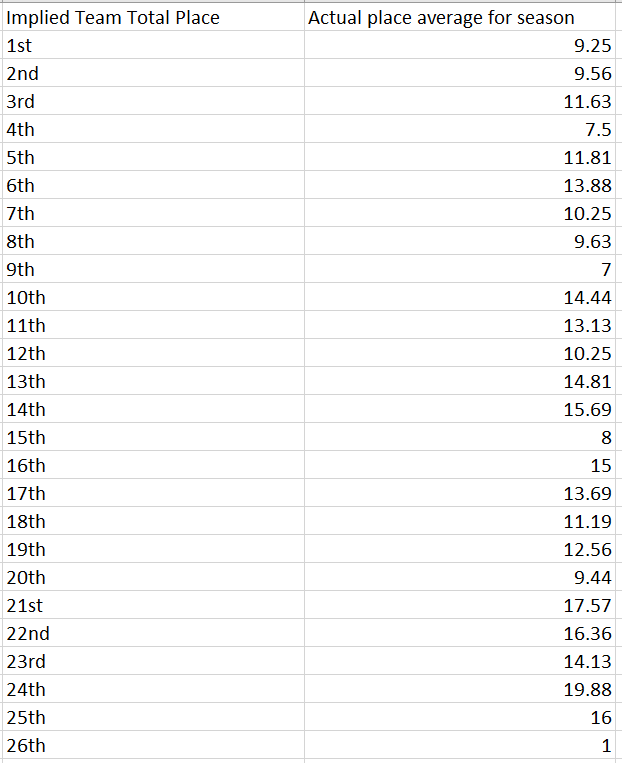
Ninth, 15th, and 20th places have a particularly higher average actual place than the places around them. Will the law of averages win out rest-of-season, meaning that teams with those particular implied places will underproduce?
Of interest, 3rd and 6th places are particularly lower than those around them. If the law of averages works in their favor, that means we’ll want to give a little extra attention to which teams FoxBET is assigning those implied team total places to.
Also interesting is that last place (26th) only includes one team, the Jaguars. Their implied team total in week 3 was the lowest of all teams, but they ended up scoring the most in a 38-10 win over the Chargers on the road.
WINNING LINEUPS’ POSITIONAL PLACING
When discussing which positions to target in my 150-lineup strategy piece, I suggested that focusing on nailing the highest-scoring running back and the two highest-scoring wide receivers were optimal.
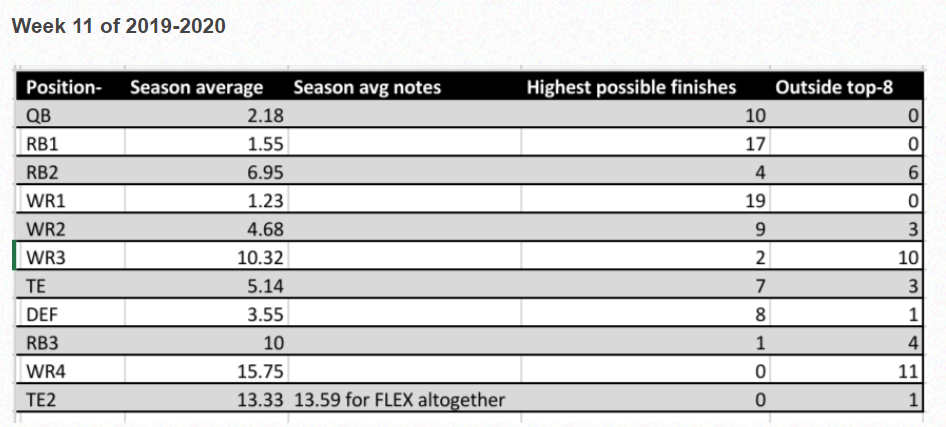
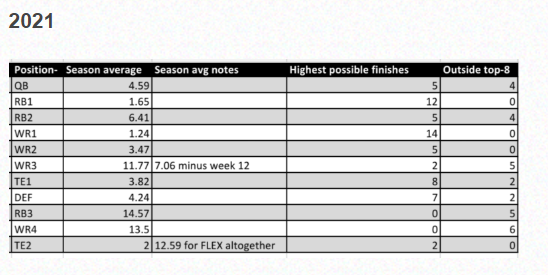
This was due to the fact that although QB, RB1, and WR1 had the highest positional placing in 2019-2020, and thus the positions that you needed to nail the most if winning the Milly, the top positions in 2021 were RB1, WR1, and WR2, while QB had fallen all the way down to sixth (I’m not including TE2 here, since it only includes two games).
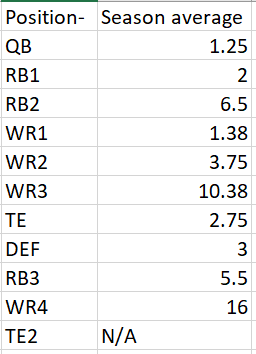
Well, this year, the QB position wasn’t just a part of the top three so far, it’s been the top position:
There is still an argument to be made that RB1, WR1, and WR2 are the positions to focus on. That’s because focusing on just RB and WR allows your player pool to include a couple more players for each position than if you were accounting for QB, RB, and WR. And, with enough of your lineups naturally aiming for the best-upside QB odds are more than likely that they’ll be in your lineup anyway. With names like Tua Tagovailoa (twice), Joe Burrow (twice), Josh Allen, Lamar Jackson, Geno Smith (week 4), and Justin Fields (week 9), where were the surprises? Geno and Fields had already outperformed expectations for a couple of weeks before their big games.
Conversely, names on the WR side that came up on the Milly have naturally been harder ones to hit, names like Greg Dortch, Mack Hollins, Josh Reynolds, Mecole Hardman, and Parris Campbell. Running back names haven’t necessarily been surprising, but the variety of scenarios that allow RBs to be successful in a given week means that casting a wider net to better secure nailing that week’s RB1 is optimal, considering the top-scoring back wasn’t in the winning Milly only twice (the RB8 in week 3, and the RB2 in week 5).
CONCLUSION
Well, that’s all for me for now. Hopefully, this gives you some insight as we head into the last quarter of the season. And hopefully, my full-season analysis will be a little more timely, as opposed to you know, discussing weeks 2-9 when week 13 is already on the horizon. Until next time!