Part 1 gave us some guidelines for how to approach lineup-building this season. But one metric provides the foundation.
Out of 200,000+ entries, the winning Millionaire Maker lineup, on average, only scored 86.3-percent as well as it possibly could. This means that as well as those winning lineups did, you didn’t have to hit the top scorer at every position.
So then, what positions did winning lineups hit, more than others?
Linestarapp.com lists up to the top-50 Draftkings scorers at each position, back through week 11 of 2019. This gave me the opportunity to gain some insight into which positions I must hit the highest-scoring players if I hope to walk away with a million bucks.
AVERAGING WEEKLY POSITIONAL PLACING
Much like the Implied Team Total table, I took how well players in a week’s winning lineup did among the rest of their position and averaged which place they finished each week.
If the QB finished with the highest score at the position, they got a value of 1. If they finished second, they got a value of 2, etc.
RB1 means the winning Milly lineup’s top-scoring running back. RB2 was the second-highest in the lineup, etc, and the same for the other positions.
So in the following tables, the lower the value, the better the finish:
Week 11 of 2019-2020
2021
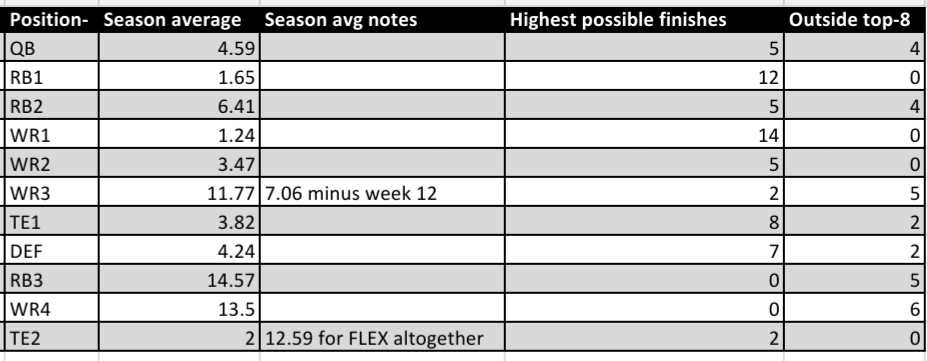
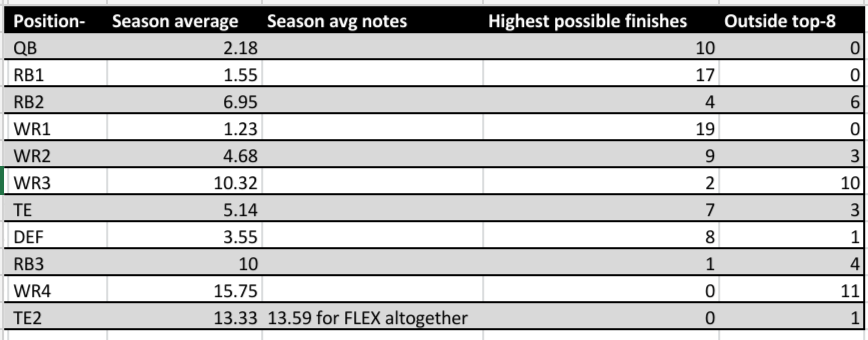
In both tables, WR1 had the best positional placing, and RB1 came in second. This makes sense considering up to four WR’s can be in a lineup, and up to three RB’s, giving those positions more chances to place well.
After that, a split happens. In 2019-2020, QB was the 3rd-best placing position at 2.18. But in 2021, QB was sixth, and WR2 took 3rd-best at 3.47.
(I don’t count TE2 due to such a small sample size of just five total Milly lineup appearances)
Why do I care so much about which position finishes 3rd-highest here? Because that’s an important part of developing the strategy I’m forming for entering 150 lineups.
KNOWING HOW MANY PLAYER COMBINATIONS ARE AVAILABLE TO YOU, AND WHY IT’S IMPORTANT
Ok, so I definitely want to have the highest placing running back, and receiver, in my lineup. The best way to make sure I accomplish that is to take a pool of players at those positions, and assemble my lineups so that every combination of players is present. That guarantees that if my pool includes the highest-scoring RB and WR, then those two players are going to be in (at least) one of my lineups.
Hitting on the best RB and WR doesn’t just cover the two historically highest-placing positions in winning Milly lineups, it also gives a little breathing room to the other positions, while still being able to win big.
To have a pool of backs and receivers where we’re guaranteed to have every RB-WR combination at least once, we have to know first how many of one position we want to use before knowing how much of the other position is available to us.
If we only like one RB, we can have 150 WRs in our pool. If we like two RBs, we can have 75 WRs. If we like:
- 3 RBs, we can have 50 WRs
- 4 RBs, 37 WRs
- 5 RBs, 30 WRs
- 6 RBs, 25 WRs
- 7 RBs, 21 WRs
- 8 RBs, 18 WRs
- 9 RBs, 16 WRs
- 10 RBs, 15 WRs
- 11 RBs, 13 WRs
- 12 RBs, 12 WRs
…and you could flip the positions on this list also.
Now, maybe you don’t like 12 RBs, or 12 WRs, or let alone 37 at any position. Having a smaller player pool would allow you to reuse combinations that you feel good about many times.
But if the point is having unique combinations to increase the odds of one of them hitting big, how much more of an advantage would it be if we incorporated a third position?
Focusing on combinations of three utilizes the strategy of increasing our odds for a big payday incase our player pool has the highest-scoring player at those positions.
In that case, what would that third position be?
LOOKING AT THE TABLES COMBINED, AND THE OPTION OF PIVOTING AWAY FROM QB
Week 11 of 2019 through 2021
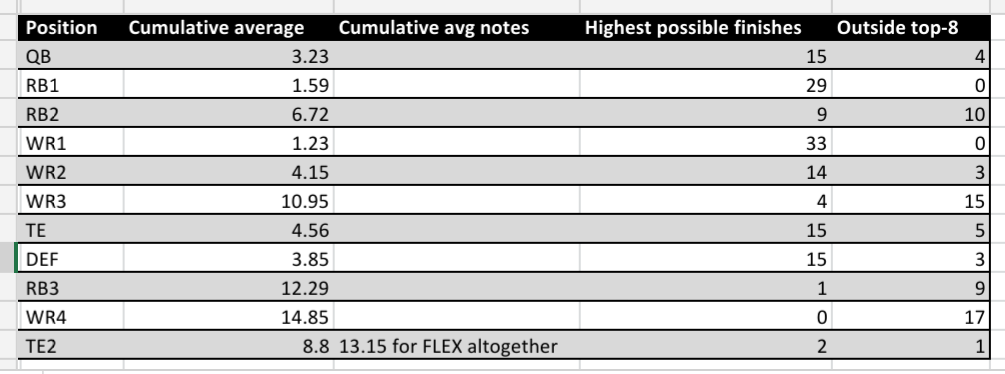
At 3.23, QB is the third-highest placing position since week 11 of 2019. If we incorporated QB into our player pool, we could guarantee every combination by picking 1 QB, 1 RB, and 150 WRs…
…okay, nobody’s doing that.
The arrangement that gives us the closest to the equal number of players per position is:
- 5 QBs, 5 RBs, 6 WRs
…where again, you could rearrange the positions to give you 6 QBs instead, or 6 RBs.
But what if you wish you had more backs and receivers in your pool, does it nullify trying to hit the highest-placing player at three positions?
Not if you pivot from QB to WR2.
WR2 has done nearly as good in positional placing as QB, and focusing on WR2 means that we can do something different, and arguably better than focusing on QB.
Let’s make our player pool 8 running backs, and 7 wide receivers. Now, let’s designate the WR1, 2, and 3 spots for only those 7 receivers, and designate the RB1 and 2 spots for only those 8 running backs.
Why? Because those 7 receivers, used in 3 spots, give us 35 unique combinations. We can use each of those unique combinations four times, by pairing them with 2 out of the 8 running backs in our pool, making sure never to pair an RB twice with the same WR combination.
That totals 140 unique 2 RB/3 WR combinations. If the highest-scoring RB and two highest-scoring WRs were in your player pool, then you’ve given one of your lineups even more breathing room to the rest of that lineup to help you hit it big.
Not only that, but let’s say you didn’t hit the highest RB1, WR1, and WR2 that week. You still constructed your lineups so that the best unique combination has a shot to land some dough. Say the highest-scoring players in your pool were that week’s RB3, RB6, WR2, WR9, and WR15. That’s going to be one of your lineups, which still gives you a realistic shot to hit big.
And maybe you didn’t string together that week’s RB1-WR1-WR2, you’ve got 18 weeks to do it.
COMPLEMENTING POSITIONAL PLACING STRATEGY WITH GUIDELINES FROM PART 1
Hopefully, this Draftkings article helped you think about different ways to deploy your lineups, or spark an idea not covered here. Where’s the end of the road in trying to find an edge in DFS? I’m not sure.
For now, we have positional placing to help us set unique combinations in our lineups with the purpose of increasing our chances of one of those combinations making us a lot of cash.
And, we can do that with these guidelines in mind:
- QB-WR (no runback) was a common winning main stack
- Use at least one QB-less stack (keep RB/WR in mind, and if you’re a believer in 2021, keep RB-DEF and WR-DEF in mind also)
- Winning lineups have supported a good number of stack variations
- 75-125 total player ownership percentage is still the norm
- So is using all $50,000 of the salary cap, or very close to all of it
- Average player cost of our stack/runback is between $5175-$7000
- Stacking based on the highest projected total points game wasn’t much help
- Stacking the team with the highest implied team total had a subtle, but clear, advantage
- Stacking the team with the 2nd- or 3rd-highest implied team total had an even less subtle, yet still clear, advantage
With over 200,000 entries, the advantage of any strategy is ever so slight. This leaves room for a bit of variance in your own strategy. One trick you can do is once you find a variant strategy you like, stick with it every week.
Do you want to focus on the upper half of the 75-125% total player ownership range? Do it up. If you’re not having any luck, and are tempted to change it, don’t. Maybe winning lineups are continuously in the bottom half of the range, but history shows (just like in 2021) that weeks in the upper half of the range are on the horizon. You don’t want to change your strategy just before that happens.
Want your main stacks just to be doubles? Want to attack a smaller range of the main stack/runback’s average player cost? Want to focus on QB1-RB1-WR1, instead of RB1-WR1-WR2? The same reasoning applies.
And with that, it’s on to 2022. See you on the main slate!


