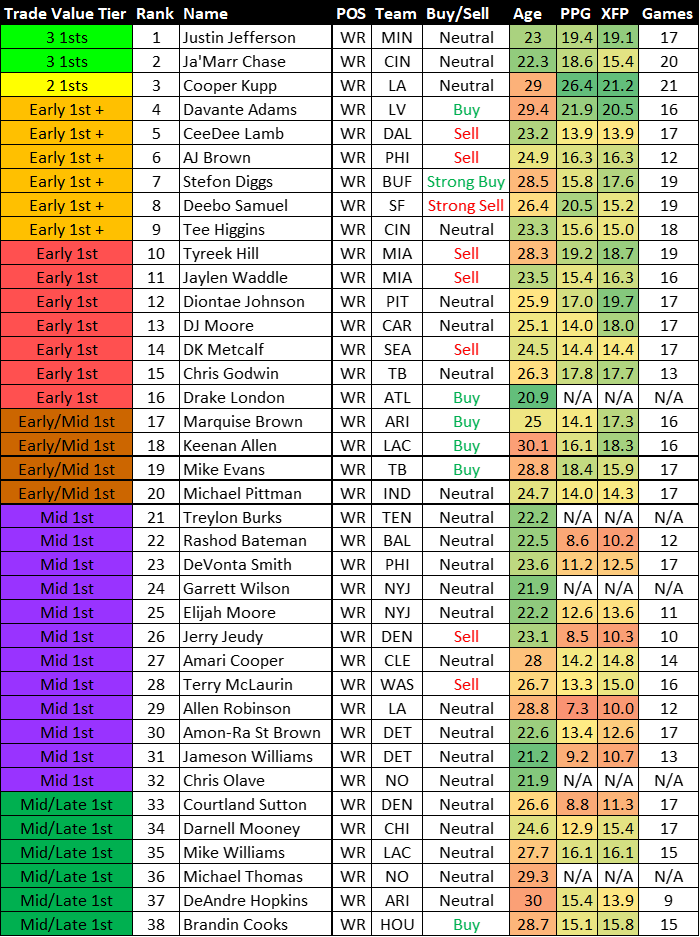
This 2022 dynasty fantasy football trade value chart looks different than other trade charts you’re used to seeing. Most other analysts take their dynasty rankings, apply arbitrary numbers to each player based on rank order, and call it a day.
I tried to make this wide receiver chart more useful by providing context. Explanations for each column can be found at the bottom of the page.
All values are based on a 12-team Superflex league with 10 starters and full-PPR scoring without TE premium. Click the links below to see values for other positions.
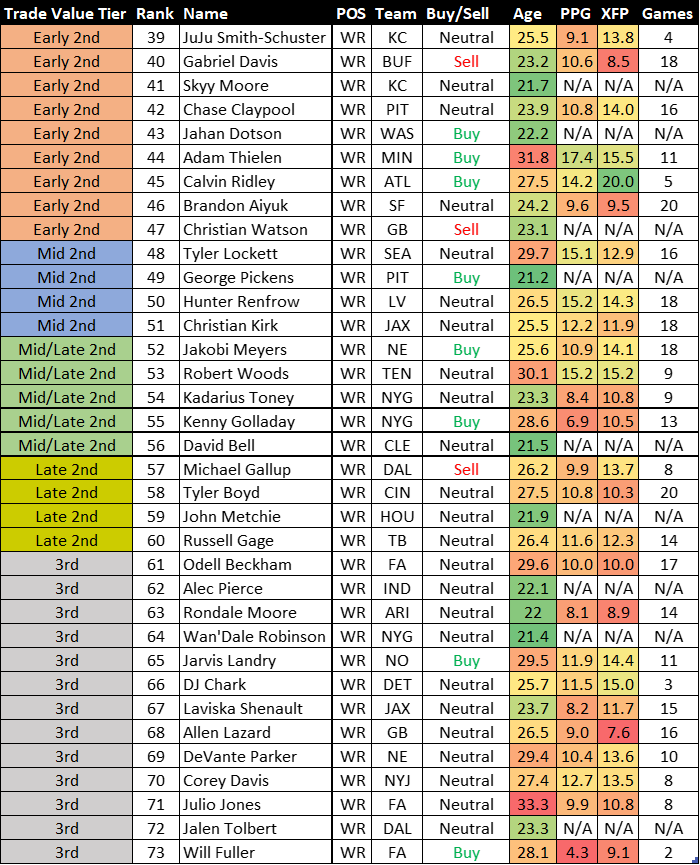
KEY:
Trade Value Tier
This column provides the rough market value for each player in terms of draft capital. Players and picks can be combined to create fair offers. For example, a player worth three first-round picks would be roughly equivalent to a player worth two first-round picks, plus a different player worth one first-round pick.
Rank
This column contains my dynasty rankings by position. I recommend focusing more on the trade value tier than the rank column. Players within the same tier are very similar, and I would usually like to trade players at the top of a tier for a lower-ranked player in the same tier if I can get draft picks or other assets on top. The rankings take market value into account.
Buy/Sell
I would look to target players in trades labeled “Strong Buy” or “Buy” if you can acquire them for market value. I would look to trade away players labeled “Strong Sell” or “Sell” if you can get market value in return. The ranks and tier values take market value into account, so I believe players labeled “Buy” will either produce more fantasy points than their market value indicates or increase in market value in the future. The opposite is true for players labeled “Sell”.
For example, Joe Burrow has a sky-high market value despite producing only 19.0 fantasy points per game last season. Deshaun Watson averages 22.3 fantasy points per game for his career. Despite a major risk with Watson, I believe he will ultimately be the better fantasy producer. However, if I was choosing between Watson and Burrow today in a startup, I would still take Burrow because his market value is much higher than Watson’s. I would simply trade Burrow later either for Watson plus other assets, or a different QB. That is why Burrow is listed as a “Strong Sell” and Watson a “Buy,” but Burrow is ranked above Watson on the chart.
2021 PPG
This column is based on all 2021 games, including the NFL playoffs. When calculating these values, I removed all games where a player got injured and left the game early while missing a significant amount of their normal snaps. In addition, meaningless Week 18 games were removed for a few players who saw a drastically reduced snap share.
For example, Christian McCaffrey‘s numbers increased significantly when removing the games he left early. I believe makes more sense to have a picture of how good a player is when playing and consider injury risk separately. Guys like Saquon Barkley and Antonio Gibson who played injured last year were not adjusted unless they left a specific game early with an injury.
XFP (Expected Fantasy Points)
This column contains data from the same games with all of the same injury adjustments as the PPG column.
XFP calculates the value of each target and rushing attempt based on the distance to the end zone and air yards. These historical data attributes correlate highly with actual fantasy points scored (PPR scoring).
For more information on Expected Fantasy Points and to utilize our XFP data tool, click the link below:
RSJ’S XFP TOOL: CARRIES, TARGETS, AND AIR YARDS FOR EVERY PLAYER
