If you have read any of my previous buy low, sell high trade articles, you know that I love high-volume fantasy players. However, raw targets and carries are only part of the equation.
On average, a goal-line carry is worth more than a carry from your own 20-yard line. A red-zone target is worth more than a target at midfield. A 40-yard bomb is worth more than a screen pass behind the line of scrimmage.
That’s obvious.
The less obvious part is quantifying exactly how much more valuable one play is than the next. Fortunately, we can quantify the exact value of each target and carry using my Expected Fantasy Points model.
*DOWNLOAD The Expected Fantasy Points Report – Week 5 2020 – PDF*
**DOWNLOAD THE EXCEL VERSION!**
The PDF contains the same data sorted in several different ways. Download the Excel file from the second link to filter the data however you want!
Expected Fantasy Points
I built the model based on a metric called Expected Fantasy Points (xFP). A player’s xFP is calculated based on the value of each target or carry, using historical data attributes that correlate highly with actual fantasy points scored. All data in this article uses full PPR scoring.
Expected Fantasy Points essentially show what an average player would have done with the opportunities seen by any given player. We can then subtract the player’s actual fantasy points scored to arrive at the difference, a key metric.
The difference between expected and actual fantasy points comes from two sources:
Talent/Situation
We would expect the most talented players in the NFL to score more fantasy points than their expected fantasy points. That’s pretty obvious since xFP is based on the averages of all players. Also, a given coach or scheme might lead to a sustainable difference in actual over expected points. A carry in Kyle Shanahan’s offense will typically produce more points than a carry in Adam Gase’s offense. A carry behind an elite offensive line would be more valuable than a poor one.
These are all sustainable ways for a player to consistently outperform or underperform their expected points. Because of these differences between players, we should not assume that the difference between expected and actual points will always regress to zero. In other words, don’t blindly buy any player with a negative difference. Don’t sell every player with a positive difference.
Luck
The main reason to use expected fantasy points is to identify players who are experiencing very bad or very good luck. Unlike the previous differences, luck will even out over a long period. We want to buy players who are having bad luck and sell players who are having good luck.
Separating differences that are sustainable from differences due to luck can be tricky. It’s not an exact science. However, most players will score within a few points per game of their expected fantasy points for the season. The players with the largest differences are the ones most likely to be benefitting or suffering from luck.
Model Inputs
Now that you understand the value of Expected Fantasy Points, I will explain how I calculate Expected Fantasy Points in my model. If you don’t care about the details, skip this section. If you have more detailed questions or comments, let me know on Twitter @RSJ_Jackson
First, I started with play-by-play data from NFLsavant. The dataset includes every play ran in the 2020 NFL season through Week 5. Then, I calculated Expected Fantasy Points for every single play using three inputs: distance from the end zone (for carries), distance from the end zone (for targets), and depth of target (for targets).
Charts
Scott Barrett, currently with FantasyPoints, published data for each of the three inputs:
And we see something similar with targets as well. pic.twitter.com/11JvitDIhw
— Scott Barrett (@ScottBarrettDFB) April 8, 2017
Expected fantasy points per target, by depth of target (air yards). [PPR vs. Standard] pic.twitter.com/sBzkQxqxkQ
— Scott Barrett (@ScottBarrettDFB) February 10, 2017
These values are from previous years, but they are extremely sticky from year-to-year. As an added check, the total number of actual fantasy points in my dataset is currently 10,765. The total expected number of points is remarkably close: 10,756! These values should be very close over a large sample size if the inputs are correct.
After calculating actual and expected points for every play, I simply match each play with the relevant player to generate the output. Roughly the top 200 players for the 2020 season are included.
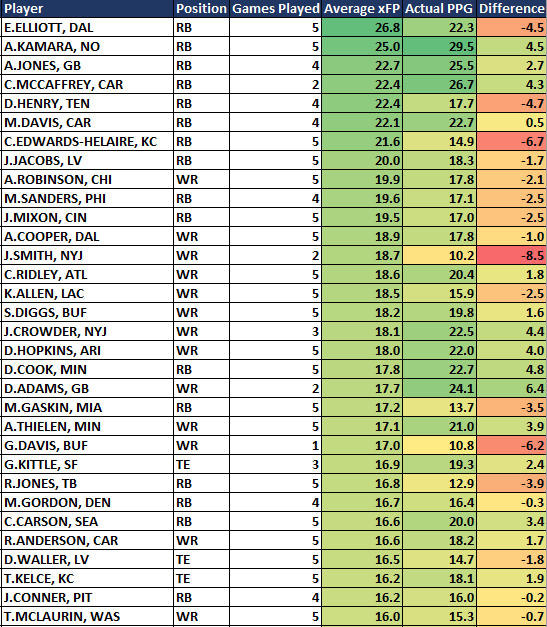
Below is a small sample of the data:
*DOWNLOAD The Expected Fantasy Points Report – Week 5 2020 – PDF*
**DOWNLOAD THE EXCEL VERSION!**
Trade Targets
During the season, the main purpose of using my Expected Fantasy Points model is to help you win trades. Remember, we want to buy players who are getting unlucky, and sell players who are getting lucky. Here’s a more general overview of my trading strategy.
You should look at the data and come to your own conclusions, but several guys jump out to me.
Week 6 Buy Low
Clyde Edwards-Helaire: Edwards-Helaire is scoring a whopping 6.7 fewer PPG than expected, good for third-highest in the league. He was a great prospect coming into the league and is currently in a great situation, so this screams bad luck. Check out my detailed writeup on CEH from last week.
Edit on 10/15/2020: Le’Veon Bell has signed with the Chiefs. I no longer believe in my previous analysis of CEH.
Keenan Allen: If you remove his Week 5 game when he was knocked out with an injury, Allen is the overall WR1 in xFP per game on the season. He is scoring 4.8 fewer PPG than expected. If he can bounce back from his back injury on Monday night, look for his production to climb even higher due to his massive volume.
Joe Mixon: While Mixon’s value skyrocketed after his 42-point explosion in Week 4, he fell back down to Earth in Week 5, scoring 15.8 points. However, he had an expected total of 24.3 points in Week 5, similar to his expected total of 27.2 in Week 4. He still saw elite usage in Week 5 despite the drop in points.
Week 6 Sell High
Raheem Mostert: Mostert is scoring 7.6 more points per game than expected, by far the most among running backs. While some of this difference is due to talent and scheme, he has scored two very long touchdowns in 3 games. He left early due to injury in Week 2, but Mostert still needs more volume to continue his current production.
Robert Woods: Woods is producing solid WR2 numbers, sitting at WR15 on the season. However, he is outproducing his expected fantasy points by 4.1 points per game. He is not seeing the same volume that he saw last year, on pace for only 99 targets. While Woods is talented, his numbers are likely unsustainable without an increase in volume.
Mark Andrews: Only Robert Tonyan (over a small sample) is outproducing his expected fantasy points by more at the tight end position. The Ravens are throwing the ball at an extremely low rate, limiting Andrews’ chances. If you have a capable alternative at TE, look to capitalize on Andrews’ solid previous two weeks.
Final Thoughts
Now that you’re an Expected Fantasy Points Expert, you can use the tool to dominate your league. Thanks for reading, and please send any questions or feedback to @RSJ_Jackson